Liquefaction evaluation method of coral sand: Case study on the ports in Indonesia
 Zezhou Ji*
  Yingmin Zhang
- CCCC First Harbor Consultants Co., Ltd., Tianjin, China
While the liquefaction evaluation methods of siliceous sand have undergone extensive studies, few research efforts were conducted to establish standard for the liquefaction susceptibility of coral sand. The current study develops an innovative method to evaluate the liquefaction potential of coral sand. Specifically, the method integrates the grain-size distribution of coral sand, effective overburden stress and equivalent seismic acceleration. Scanning electron microscopy image of coral sand was processed to reveal the microstructural characteristics of coral sand. The correction equation for standard penetration resistance of coral sand in Indonesian ports was given based on geotechnical investigations, and the recommended values of correction factors were proposed for the regions lacking relevant data in the previous period. The process for liquefaction evaluation method of coral sand was described and applied to evaluate the liquefaction potential of coral sand in Indonesian port projects. This study demonstrates the feasibility of integrating standard penetration test and grain-size distribution for liquefaction evaluation of coral sand.
1 Introduction
With the continuous expansion of scientific research and engineering projects, coral sand and other special soils have brought a series of new difficulties and challenges to the construction of coastal ports along the 21st-Century Maritime Silk Road. Unlike siliceous sands formed by physical or chemical origin, coral sands are mostly calcareous sands formed by various marine organisms such as corals and shells through long-term geological effects (Wu et al., 2022) (Figure 1). Coral sand is a special geotechnical material that is widely distributed in tropical oceans between N30° and S30°, and it has been found in the Caribbean Sea, Hawaii, Polynesia, Indonesia, the north coast of Australia, the Indian Ocean, the Persian Gulf, the Red Sea, the South China Sea (Lv et al., 2019; Yang et al., 2022).
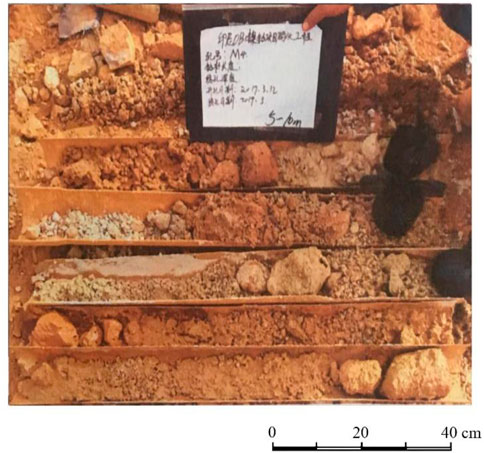
FIGURE 1. Image of coral sands at a nickel-cobalt ore port in Indonesia.
Changes in microstructure and microfracture will affect mechanical properties (Liu et al., 2006; Shih et al., 2010; Liu et al., 2022). There is a correlation between concrete pore size and UCS (Liu X. et al., 2020b). Microstructure can by employed to observe deformation and failure of materials (Wang et al., 2015; Zhao et al., 2015; Liu N. et al., 2020a). Previous studies have shown that coral sand has many characteristics that are different from siliceous sand, such as irregular particle shapes (Wang et al., 2019), high particle angularity (Hyodd et al., 1998; Brandes, 2010; Morsy et al., 2019), large porosity (Wang et al., 2014), low mechanical strength (Arumugam and Ramamurthy, 1996; Coop et al., 2004; Wu et al., 2018), high compressibility (Wang et al., 2011), and high carbonate content (Xiao et al., 2018), owing to its special marine biological origin. Hassanlourad et al. (2014) reported quartz sand was greatly affected by the initial relative density, while coral sand was significantly influenced by the inherent filler. When calcareous sand and siliceous sand are tested under similar conditions, calcareous sand is more malleable and contractile and has a larger peak friction angle than siliceous sand with similar grain-size distribution, while siliceous sand has higher shear modulus (Carraro and Bortolotto, 2015; Giang et al., 2015) and damping (Brandes, 2010; Catano and Pando, 2010). Coral sand is less susceptible to liquefaction than siliceous sand with the same relative density under similar conditions (LaVielle, 2008; Pando et al., 2012).
Terzaghi and Peck (1967) used the term soil liquefaction to describe the sudden loss of strength of sandy soils that lead to flow slides by a slight disturbance. Numerous strong earthquakes, such as the Guam earthquake of 1993, the Hawaii earthquake of 2006, the Haiti earthquake of 2010, and many others, exhibited the extensive damage caused by intense shaking of calcareous sands, and the liquefaction of calcareous sands was observed in these cases, leading to severe damage to coastal port facilities (Brandes, 2010). Soil liquefaction also caused severe damage to the port facilities in the earthquake of Kobe in 1995 (Robertson and Wride, 1998). Attempts thus far have been carried out to explore the liquefaction susceptibility of siliceous sand. The cyclic stress ratio is commonly employed to evaluate the liquefaction potential of siliceous sand. The dynamic properties of coral sand vary significantly from those of siliceous sand. The strength of coral sand is low, and the particle breakage is easy to occur under the seismic action, leading to changes in compactness. The relative density, depth reduction coefficient and confining pressure have a great influence on the cyclic stress ratio. Therefore, the variability of liquefaction evaluation results by using conventional cyclic stress ratio is large according to the above-mentioned arguments. Besides, the standard penetration test-based procedure (Seed and Idriss, 1971), cone penetration test-based procedure (Robertson and Wride, 1998), and shear wave velocity-based procedure (Andrus and Stokoe II, 2000) are also employed to assess the liquefaction potential of sandy soils. At present, liquefaction resistance evaluation results of coral sands are not accurate. There are obvious shortcomings in using the liquefaction evaluation standards of siliceous sand to assess the liquefaction potential of coral sand. Hawaii seismic data in 2006 showed that the in-situ modified shear wave velocity of the coral sand liquefaction layer was 314 m/s, which was 43% higher than the upper limit of modified shear wave velocity for siliceous sand to reach liquefaction. Applying the liquefaction evaluation method of siliceous sand to coral sand will cause obvious misjudgment, thus leading to unnecessary investment in projects (Shahnazari et al., 2016). Tang et al. (2013) compared various liquefaction evaluation methods, such as the standard penetration test method, and shear wave velocity method. However, the applicability of these methods to the assessment of liquefaction potential of coral sands requires further study. Research efforts on liquefaction evaluation methods of coral sand are not sufficient; hence it is of great practical significance to investigate the liquefaction evaluation method of coral sand.
This research aims to explore a method to study the liquefaction susceptibility of coral sand based on the liquefaction evaluation method of siliceous sand. The method has been successfully applied in the design of relevant port projects in Indonesia. This paper demonstrates the feasibility of integrating the grain-size distribution and standard penetration resistance for liquefaction potential analysis, and confirms the broad application prospects of this method.
2 Test procedure and theoretical study of liquefaction evaluation method
2.1 Sample preparation and treatment
Coral sands were sampled within a nickel-cobalt ore port in Indonesia. 23 coral sand samples were drilled for geotechnical tests within the depth range of 4.15–14.45 m in the pontoon berthing area. Geotechnical tests were conducted as per GB 50021-2009 (Ministry of Housing and Urban-Rural Development of the People’s Republic of China, 2009). The average value of the experimental results was taken as the characteristics of coral sand to reduce experimental deviations.
2.2 Image processing of coral sands
Since the microstructural characteristics of coral sand particles and pores are closely related to the engineering properties of coral sand, it is necessary to analyze the microstructure of coral sand for exploring the liquefactions susceptibility of coral sand. The microstructure of coral sand can be obtained by scanning electron microscope images (Seneviratne et al., 2020; Zhang et al., 2022a).
Although the large magnification image shows the shape and size of particles and voids in detail, it is difficult to accurately represent the real microstructure of coral sand due to the small number of particles and voids. It can only characterize the local microstructure of coral sand. The image with small magnification presents a large number of particles and voids; however, too small a magnification can make coral sand particles and voids indistinguishable. In the microstructural characterization analysis of coral sands, the microscopic image should cover as many particles as possible while ensuring the clear representation of particles and voids. The magnification of coral sand image of coral sand used in this paper was 100 times after fully considering the above arguments. Scanning electron microscope images of coral sand were collected at a 15 kV voltage.
The image was processed by the spatial domain method to remove or attenuate image noise and highlight the edge contours of the objects for easy target recognition. Soil is a three-phase system consisting of solid gas water (Bi et al., 2018; Bi et al., 2020). Dry coral sand is considered as a two-phase system composed of solids and gases. The threshold segmentation method was employed to divide the processed image into two regions, namely, coral sand particles and voids (Matsushima et al., 2009; Zhao et al., 2015; Zhang et al., 2022b). The binary image of coral sand was thus obtained, and microstructural parameters of voids were then extracted.
The binary images of coral sands allow the quantification and analysis of microstructural parameters such as surface porosity, void equivalent diameter and void area. The void equivalent diameter in two-dimensional space refers to the diameter of an equal-area circle, as shown in Eq. 1.
where D is the equivalent diameter of void; and S is the area of void.
2.3 Liquefaction potential of siliceous sand by standard penetration test (SPT)
According to the Chinese Code for Seismic Design of Buildings (Ministry of Housing and Urban-Rural Development of the People’s Republic of China, 2016), the liquefaction index for each borehole can be calculated by
where
As for the liquefaction index, when 0<
2.4 Liquefaction susceptibility of coral sand
The susceptibility and hazard degree of coral-sand liquefaction should be investigated based on the properties of the sand and seismic intensity at the site. The grain-size distribution and standard penetration test (SPT) are firstly conducted for liquefaction evaluation. If the results are near the dividing line between occurrence and non-occurrence of liquefaction, the cyclic triaxial test should be employed for further determination.
2.4.1 Liquefaction susceptibility of coral sand by grain-size distribution
As shown in Figure 2, if the grain-size distribution curve of sand is outside the range of the possible liquefaction boundary, the sand may liquefy. The influence of the uniformity coefficient
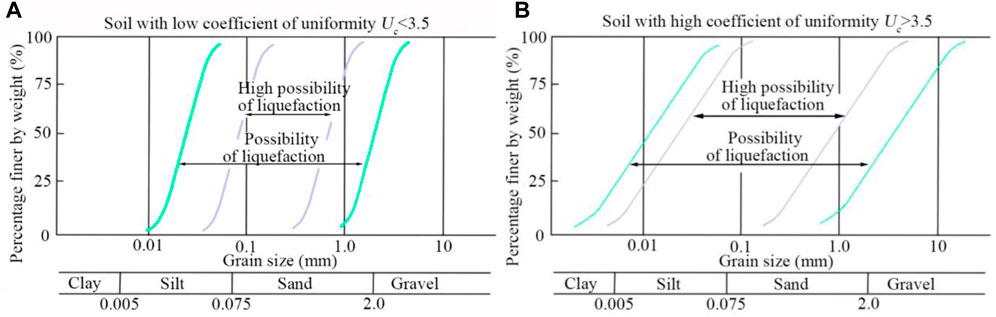
FIGURE 2. Grand-size distribution curves of possible liquefied soils: (A)
2.4.2 Liquefaction susceptibility of coral sand by equivalent SPT blow count and equivalent acceleration
The equivalent SPT blow count
where
As for the N value of coral sand, many scholars have suggested the relationship between the cone head resistance of siliceous sand and calcareous sand by referring to the static penetration test. Almeida et al. (1991) believed that the cone head resistance of siliceous sand was about 1.8–2.2 times that of calcareous sand, while Cudmani (2000) found that the ratio was between 1.4 and 3.5, and the specific value was related to the relative density. In the static penetration test, the end resistance and side resistance of quartz sand were about 1.3–2.2 times that of coral sand. Foray et al. (1999) compared the ultimate pressure of siliceous sand and calcareous sand, and demonstrated that the ultimate bearing capacity of siliceous sand was 2–3 times that of calcareous sand, and the ultimate bearing capacity was related to the initial confining pressure. According to the above-mentioned literature study, siliceous sand is about twice the SPT blow count of calcareous sand under the same confining pressure and compactness. Therefore, in the liquefaction evaluation analysis of coral sand, the measured SPT blow count can be scaled and then combined with the traditional liquefaction evaluation method of siliceous sand. Eq. 3 can also be represented by Figure 3.
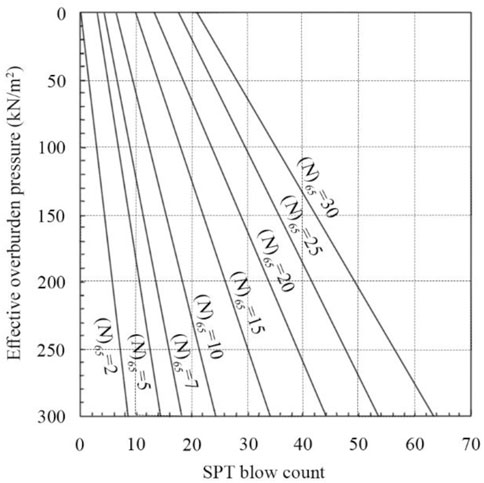
FIGURE 3. Modified SPT fitting curves.
Equivalent acceleration can be calculated by
where
According to the equivalent SPT blow count and equivalent acceleration, the liquefaction potential of coral sand can be determined according to Figure 4.
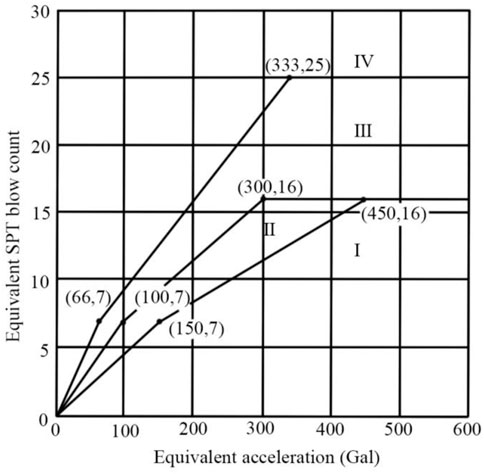
FIGURE 4. Liquefaction susceptibility zoning of SPT.
Liquefaction potential in each zone is as follows:
If the equivalent acceleration and equivalent SPT blow count of coral sand fall in zone I, then liquefaction will certainly occur.
If the equivalent acceleration and equivalent SPT blow count of coral sand fall in zone II, then coral sand has a high probability of liquefaction, and further evaluation should be conducted by combining the results of cyclic triaxial test.
If the equivalent acceleration and equivalent penetration of coral sand fall in zone III, then the liquefaction potential of coral sand is small, and the cyclic triaxial test should be employed for further determination.
If the equivalent acceleration and equivalent penetration of coral sand fall in zone IV, then coral sand will certainly not liquefy.
When the fine soil content is more than 5%, the SPT blow count should be corrected. The fine soil content of the site is 3%; hence there is no need to correct the SPT blow count.
2.4.3 Steps for liquefaction evaluation of coral sand
The shear strength of coral sand density is 1.8–2.2 times that of siliceous sand with the same relative density under similar conditions. The SPT blow count should be multiplied by the correction coefficient. The experimental results of Indonesian coral sand with the effective overburden stress of 0 kPa–100 kPa were regressed, and the formula of correction coefficient
where
For Indonesian coral sand, the SPT blow count was corrected according to Eq. 5. Thereafter, the combination of grain-size distribution and SPT can assess the liquefaction susceptibility of coral sand. The specific steps are as follows:
(1) The SPT blow count of coral sands at different depths is determined by field SPT;
(2) Acid drop test is performed using disturbed samples to obtain the content of calcium ions to determine the type of sand;
(3) The grain-size distribution and uniformity coefficient are investigated by sampling and sieving test;
(4) The measured grain-size distribution curve of coral sands is compared with the possible liquefaction zone corresponding to the uniformity coefficient in accordance with Figure 2. If the curve is outside the liquefiable area, the liquefaction will not occur. Otherwise, the liquefaction evaluation needs to go to the next step.
(5) The equivalent SPT blow count can be obtained according to Eq. 3 or Figure 3;
(6) The theoretical range of relative density of coral sand is 0<
(7) The equivalent acceleration is calculated according to Eq. 4;
(8) The liquefaction of coral sand can be identified by combining the corrected SPT blow count and equivalent acceleration according to Figure 4.
2.5 Engineering projects
2.5.1 A nickel-iron ore port project in Indonesia
The nickel-iron ore port, located in Sulawesi Island, Indonesia, is mainly used for receiving and unloading sulfuric acid, containers, and other regular cargoes. The port measures 15 m by 120 m. The pontoon is moored in front of the port, and they have their own loading and unloading equipment. The bulk carrier, with a displacement of 57,000 tons, is anchored outside the pontoon. Four exploration positions were taken in the pontoon berthing area, labeled M1 to M4. The geological conditions within the depth range of 39.0 m were investigated and the basic acceleration of ground motion was calculated. Subsequently, the liquefaction potential of the site was evaluated by the SPT and the new evaluation method proposed in this paper, respectively.
2.5.2 A nickel-cobalt ore port project in Indonesia
The nickel-cobalt ore port, located in Sulawesi Island, Indonesia, is mainly used for receiving and unloading laterite nickel ore, and other heavy cargoes. The port measures 18 m by 150 m. Five exploration positions were taken in the port, labeled M5 to M9. Five exploration sites were selected in the revetment, labeled H1 to H5, and two exploration sites were selected in the land, labeled BH1 and BH2. Similar to the last project, the geological conditions within the depth range of 20.0 m were investigated and the basic acceleration of ground motion was calculated. Subsequently, the liquefaction potential of the site was evaluated by the SPT and the new evaluation method proposed in this paper, respectively.
3 Engineering application and validation study
This paper aims to develop an innovative method to evaluate the liquefaction potential of coral sand. Specifically, standard penetration test and grain-size distribution are considered in the liquefaction evaluation method of coral sand. This method has been applied to assess liquefaction susceptibility of a nickel-iron ore port site and a nickel-cobalt ore port site in Indonesia.
3.1 Properties of coral sands
It is necessary to obtain the basic parameters of soil to deeply understand the hydro and dynamic properties of soil (Liu et al., 2023). The basic parameters of the coral sands are provided in Table 1.
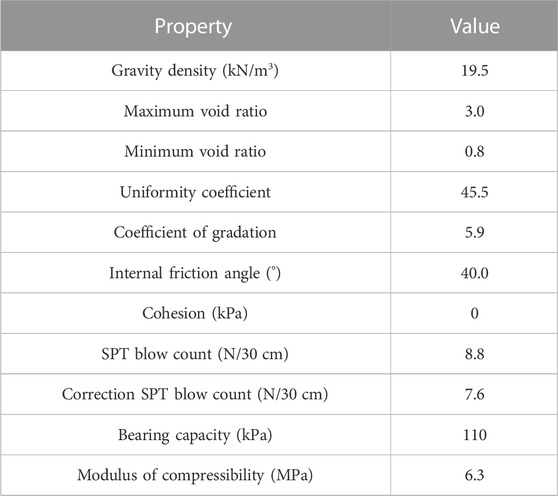
TABLE 1. Properties of the coral sands.
3.2 Microstructural characterization of coral sands
The binary image of coral sand is shown in Figure 5. Morphologies of the coral sand particles are diverse, and there are four common shapes, namely, flaky particles, dendritic particles, spindle-like particles and block-like particles. Spindle-like particles and block-like particles account for most of them. Dendritic particles, spindle-like particles and block-like particles are rich in the native internal voids of organisms. Flaky particles and spindle-like particles are prone to breakage when they are subjected to stress.
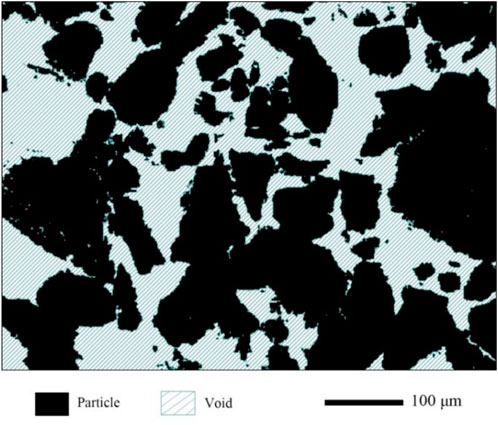
FIGURE 5. Binary image of coral sand.
As observed in Figure 6, the equivalent diameters of voids range from 1.90 µm to 121.15 µm. The average equivalent diameter of voids is 22.41 µm, and the median equivalent diameter of voids is 14.61 µm. The equivalent diameter distribution of voids is concentrated. The voids with equivalent diameters between 1.8 µm and 9.3 µm account for about 1/3 of the total number of voids, and the number of large voids is small. The variance of void equivalent diameter distribution is very small, about 0.005. The areas of voids range from 2.83 µm2 to 11527.67 µm2, with an average void area of 762.92 µm2 and a median void area of 170.36 µm2. The void area distribution is concentrated, and the number of small void areas is huge, accounting for more than 2/3 of the total number of voids, and the variance of the void area distribution is minimal, only 2.204 e-06.

FIGURE 6. Microstructural parameters of voids: (A) equivalent diameter; (B) area.
3.3 Liquefaction evaluation of a nickel-iron ore port site in Indonesia
3.3.1 Geological conditions of the nickel-iron ore port site
The strata within the depth of 39.0 m revealed by the borehole are Quaternary talus accumulation. According to their burial conditions, distribution, lithological characteristics, and physical and mechanical properties, they can be divided into the following four engineering geological layers, which are briefly described as follows:
I Plain fill (Q4ml): variegated, loose, slightly wet, mainly clay and gravel, and locally block stone.
II Coral sand (Q4dl): grayish-white, dense, saturated, and cores with short columnar or blocky shapes.
III Fine sand (Q4dl): grayish-yellow, slightly dense, saturated, moderately rounded, poorly graded, impure sand, and mainly feldspar and quartz.
Silty clay (Q4dl): grayish-brown, plastic, smooth cut surface, slightly shiny, medium dry strength, medium toughness, rust spots, and no shaking and vibration reaction.
IV Strongly weathered peridotite (pTum): grey-green, strongly weathered, mostly damaged tissue structure, broken or relatively broken core with fragmented or short columnar shape, crack development, and local water leakage.
According to the Indonesian Seismic Resistant Design Standard for Building Structures (Wangsadinata, 2002) and the Chinese Code for Seismic Design of Buildings (Ministry of Housing and Urban-Rural Development of the People’s Republic of China, 2016), the seismic precautionary intensity of the site is 8 degree. The basic ground-motion acceleration of a site with a design service life of 50 years and an exceedance probability of 10% is 0.3 g as per the Indonesia Seismic Zoning Map (2010 edition). The design seismic group of the site is Group 2. The foundation soil type of the site is medium soft soil, and the construction site category is class II, hence the site is an unfavorable earthquake-resistant area. Since the design service life of the port is 20 years, the corresponding seismic regression period is 190.3 years under the premise of 10% exceedance probability. In accordance with the earthquake regression period, it can be concluded that the 50-year exceedance probability is 23.16%. The intensity probability of the 50-year design reference period conforms to the extreme value type III distribution. Based on the known basic seismic precautionary intensity (8 degree) and exceedance probability, the corresponding seismic intensity can be deduced to be 7.45 degree. Therefore, the basic acceleration of ground motion is 0.203 g for a site with a 20-year design life and a 10% exceedance probability.
3.3.2 Liquefaction susceptibility of the nickel-iron ore port site by SPT
The liquefaction susceptibility of coral sand assessed using the evaluation method for siliceous sand is listed in Table 2. When the seismic acceleration of the site is 0.3 g, most of the boreholes in the site may liquefy according to the liquefaction evaluation method of siliceous sand. Therefore, the site is a severely liquefied area and requires avoidance or foundation treatment to eliminate liquefaction, which will greatly increase the project cost. Vibroflotation rubble piles should be used underneath the port to eliminate liquefaction. The treatment area is from 15 m from the seaside of the port front to 40 m from the land side of the port front, and the treatment depth is up to the rock surface line. The vibroflot positions are arranged in a triangular shape with a spacing of 2 m, the treatment area measures 70 m by 200 m, and the average treatment depth is 15 m. An additional investment of about 20 million yuan is needed as per the preliminary estimate.
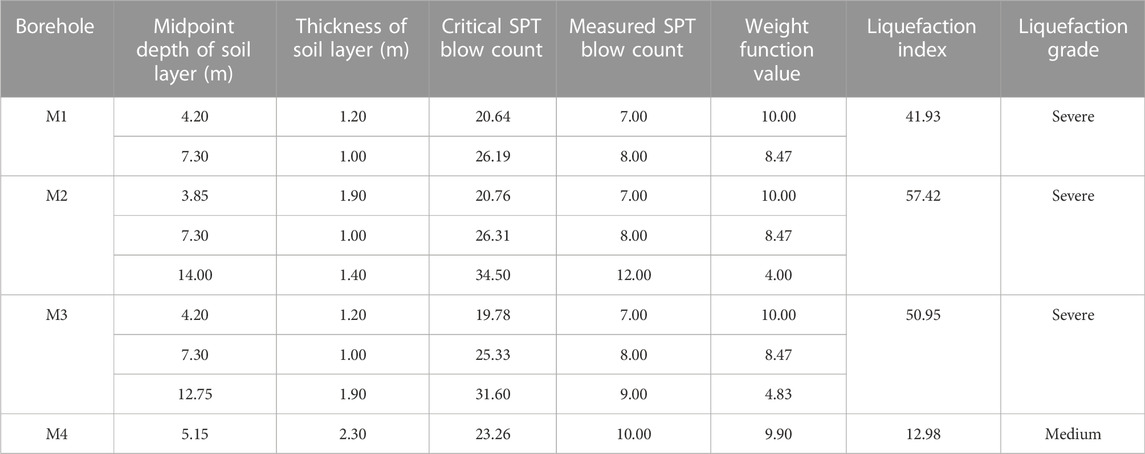
TABLE 2. Liquefaction susceptibility of port by SPT.
3.3.3 Liquefaction susceptibility of the nickel-iron ore port site by grain-size distribution and SPT
The drilling results of the port show that the stratum within 20 m of the surface layer is coral sand. Since no grain-size distribution data are available for boreholes M1 to M4, the gradation curve is considered to have fallen into the range of possible liquefaction according to the most unfavorable case, and then the liquefaction susceptibility is evaluated as per steps 5, 6, 7 and 8 described in Section 2.4.3. The relevant results are shown in Figure 7.
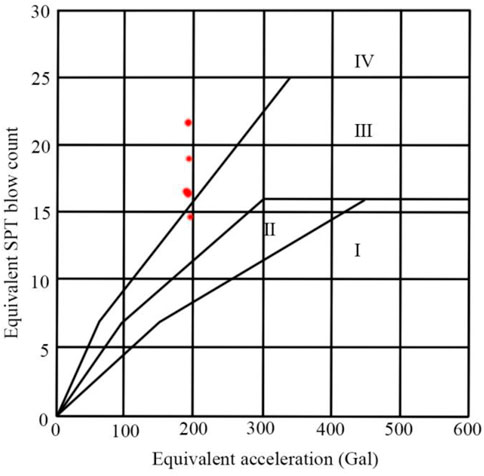
FIGURE 7. Liquefaction evaluation zoning of boreholes M1 to M4 by SPT.
The SPT data of the boreholes M1 to M4 are mostly located in zone IV, that is, liquefaction will not occur. Only the data of individual depths of borehole M3 fall into zone III, which has a low possibility of liquefaction. This liquefaction risk should be considered in the design. No foundation treatment is required for the port area, thus saving 20 million yuan in engineering cost. It has been 3 years since the project was put into operation in 2019. During this period, several earthquakes have occurred, and no liquefaction has been observed at the site.
3.4 Liquefaction evaluation of a nickel-cobalt ore port site in Indonesia
3.4.1 Geological conditions of the nickel-cobalt ore port site
The investigation reveals that the site strata are marine sedimentary layers and bedrock within the depth reached by the drilling, except for the plain fill. According to the burial conditions, lithologic characteristics, and physical and mechanical properties of the strata, the foundation soil of the site is divided into four engineering geological layers. The basic properties of each layer are presented in Table 3. Similar to the last engineering case, the design life of the port in this project is 20 years, and the basic acceleration of ground motion with an exceedance probability of 10% is 0.203 g. The foundation soil type of the site is medium soft soil, and the construction site category is class II, hence the site is an unfavorable earthquake-resistant area.
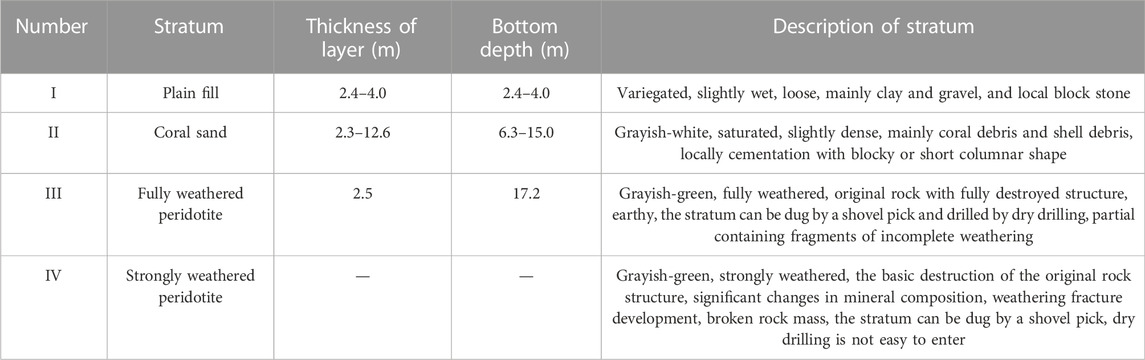
TABLE 3. Basic properties of the site strata.
3.4.2 Liquefaction susceptibility of the nickel-cobalt ore port site by SPT
The drilling results of the site show that the surface layer of 20 m is coral sand, the depth of liquefaction potential evaluation is 15 m, and the buried depth of the site foundation is 3 m. The liquefaction susceptibility assessment of the port area is carried out based on the method described in Section 2.3, and the results are demonstrated in Table 4.
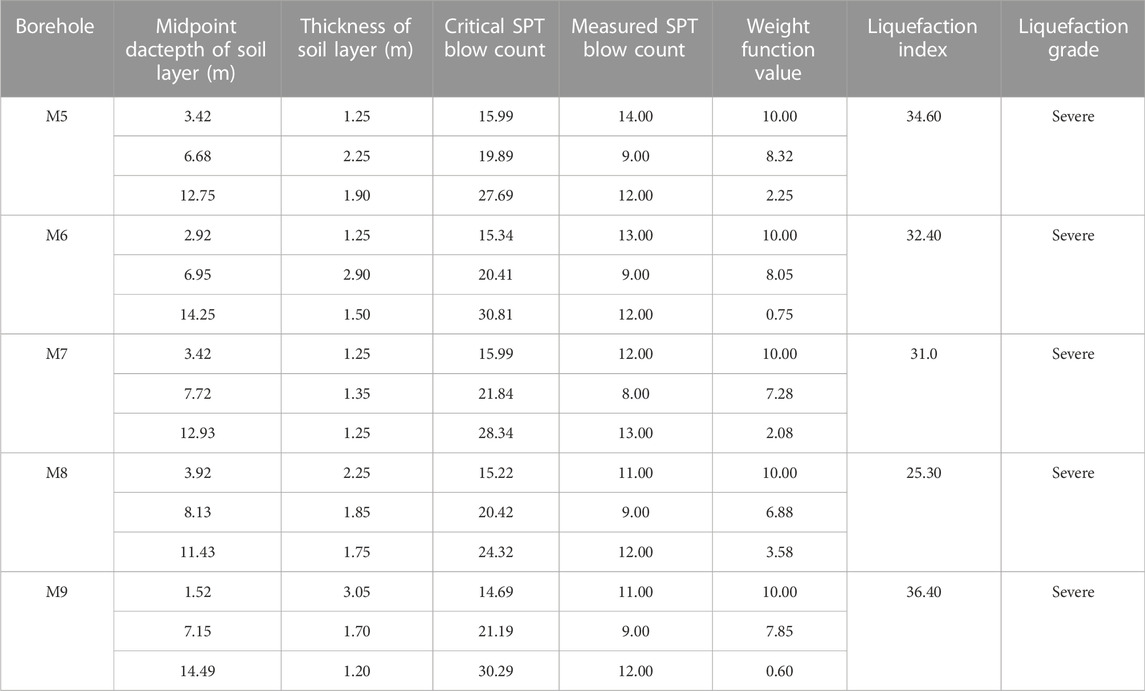
TABLE 4. Liquefaction susceptibility of the nickel-cobalt ore port site by SPT.
Severe liquefaction will occur in all boreholes in the site in accordance with the evaluation method for siliceous sand. The site needs to be avoided or ground treated to eliminate liquefaction, which will significantly increase the project cost. Vibroflotation rubble piles are required underneath the port to eliminate liquefaction. The treatment area is from 15 m from seaside to 40 m form land side along the port front, and the depth of treatment is up to the rock surface line. The vibroflot positions are arranged in a triangle shape with a spacing of 2 m. The treatment area measures 60 m by 180 m, and the average treatment depth is 13 m. It is estimated that an additional investment of about 22 million yuan is needed.
3.4.3 Liquefaction susceptibility of coral sand by grain-size distribution and SPT
The liquefaction susceptibility assessment of drilling samples M5 to M9 in the port area is carried out based on the method described in Section 2.4, and the results are demonstrated in Figures 8, 9.
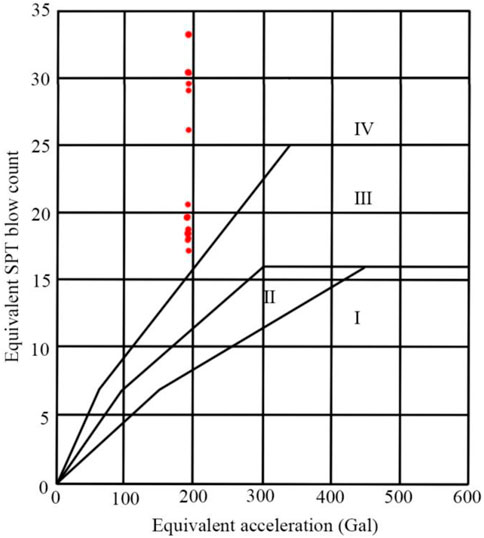
FIGURE 8. Liquefaction evaluation zoning of boreholes M5 to M9 samples based on SPT.
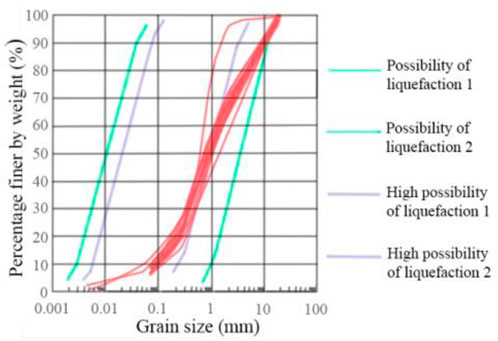
FIGURE 9. Liquefaction evaluation zoning of boreholes M5 to M9 samples based on grain-size distribution.
Boreholes H1 to H5 are located in the revetment area, and boreholes BH1 and BH2 are located in the land area. The liquefaction potential evaluation is performed based on the method described in Section 2.4, and the results are demonstrated in Figures 10, 11.
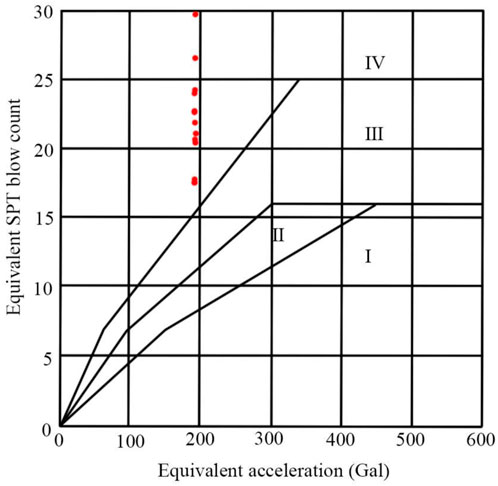
FIGURE 10. Liquefaction discrimination zoning of H1 to H5, BH1 and BH2 drilling samples based on SPT.
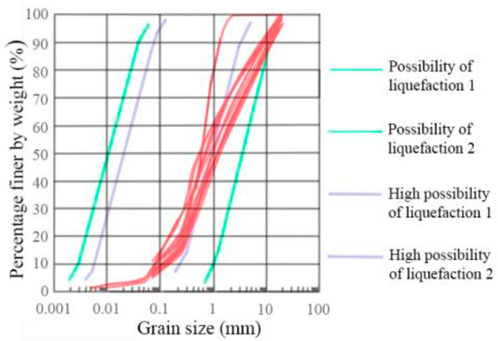
FIGURE 11. Liquefaction discrimination zoning of H1 to H5, BH1 and BH2 drilling samples based on grading curve.
For the revealed boreholes near the port, revetment and land area, the SPT data are all in zone IV, thus the site will not liquefy. The grain-size distribution curves are almost not in the high liquefaction possibility range, or have a little overlap with it; hence the possibility of liquefaction in these strata is low. In general, liquefaction will not occur in port, revetment and land area, and the effect of liquefaction on these areas does not need to be considered. Therefore, there is no need to carry out foundation treatment, which saves a large amount of the engineering cost. It has been 3 years since the project was put into operation in 2019. During this period, several earthquakes have occurred at the project site, and no liquefaction has been observed at the site.
4 Discussion
The current regulations on the liquefaction evaluation are commonly for the silica sand. Previous studies on the liquefaction evaluation of coral sand are limited. Coral sand has the following characteristics compared with siliceous sand with the same relative density and tested under similar conditions:
• The SPT blow count of coral sand is smaller than that of siliceous sand;
• Coral sand has a higher compressibility than siliceous sand;
• The internal friction angle of coral sand is larger than that of siliceous sand;
• Coral sand is less susceptible liquefaction than siliceous sand.
In the liquefaction potential assessment of the sites in the above-mentioned projects, coral sand have severe or moderate liquefaction potential according to the evaluation methods of siliceous sand, and these locations need to be avoided or ground treated to eliminate liquefaction, however, this process is time-consuming, energy-intensive, and financially costly, thus enhancing the engineering cost significantly. The new method proposed in this paper is employed to investigate the liquefaction susceptibility of coral sand in these two projects. The results show that the coral sands in most of the boreholes in the nickel-iron ore port will not liquefy. Only a borehole sample at a certain depth has a low probability of liquefaction, hence the liquefaction risk of this position should be considered in the design of port. There is no possibility of liquefaction in the nickel-cobalt ore port, revetment and land area, and there is no need to consider the influence of liquefaction on these areas. The liquefaction evaluation method of coral sand has been successfully applied to these two projects in Indonesia, the acceptance and review of them has been completed. The two projects do not need to carry out foundation treatment, which saves a large amount of engineering costs.
This research supports the construction of port projects among countries along the Silk Road Economic Belt, and fills the gaps in the current design standards and specifications for port engineering. The study provides a reference for the design of other port projects with similar conditions, and creates significant economic and social benefits.
5 Conclusion
The microstructures of the coral sands were studied though a series of image-processing and analysis procedures. The geological conditions were investigated by boreholes. A new method was proposed to evaluate the liquefaction susceptibility of coral sands and was applied to two port projects in Indonesia to verify its feasibility. The main following conclusions can be drawn based upon the presented results:
(1) The liquefaction evaluation methods of siliceous sands are not applicable to coral sands.
(2) The correction formula for the SPT blow count of coral sand is developed, and the recommended value of correction coefficient is proposed for the first time for the regions lacking relevant data in the previous period.
(3) An innovative liquefaction evaluation method for coral sand is proposed by combining the standard penetration test and grain-size distribution curve, i.e., the grain-size distribution, effective overburden stress, equivalent standard penetration test blow count and equivalent seismic acceleration are comprehensively considered to evaluate the liquefaction potential of coral sand.
(4) The liquefaction evaluation method of coral sand has been successfully applied to a nickel-iron ore port project and a nickel-cobalt ore port project in Indonesia. These two projects save a lot of engineering investment compared with the traditional liquefaction evaluation method.
Data availability statement
The original contributions presented in the study are included in the article/Supplementary Material; further inquiries can be directed to the corresponding authors.
Author contributions
ZJ: Conceptualization, Methodology, Validation, Data curation, Writing—original draft preparation, Writing—review and editing, Supervision, Project administration, Funding acquisition. XY: Conceptualization, Validation, Investigation, Resources, Writing—original draft preparation. YZ: Software, Formal analysis, Writing—review and editing. All authors agree to be accountable for the content of the work.
Funding
This research was supported by the National Natural Science Foundation of China (Project No. U1906231).
Conflict of interest
All authors are employed by CCCC First Harbor Consultants Co., Ltd.
Publisher’s note
All claims expressed in this article are solely those of the authors and do not necessarily represent those of their affiliated organizations, or those of the publisher, the editors and the reviewers. Any product that may be evaluated in this article, or claim that may be made by its manufacturer, is not guaranteed or endorsed by the publisher.
References
Almeida, M. S., Jamiolkowski, M., and Peterson, R. (1991). Preliminary results of CPT tests in calcareous Quiou s, Proceedings of the International Symposium on Calibration Chamber Testing, 28-29, 41–53.Potsdam, U. S. A. June1991.
Andrus, R. D., and Stokoe, K. H. (2000). Liquefaction resistance of soils from shear-wave velocity. J. Geotech. Geoenviron. Eng. 126 (11), 1015–1025. doi:10.1061/(asce)1090-0241(2000)126:11(1015)
Arumugam, R. A., and Ramamurthy, K. (1996). Study of compressive strength characteristics of coral aggregate concrete. Mag. Concr. Res. 48 (176), 141–148. doi:10.1680/macr.1996.48.176.141
Bi, J., Zhang, M., Chen, W., Lai, Y., and Lu, J. (2018). A new model to determine the thermal conductivity of fine-grained soils. Int. J. Heat. Mass Transf. 123 (123), 407–417. doi:10.1016/j.ijheatmasstransfer.2018.02.035
Bi, J., Zhang, M., Lai, Y., Pei, W., Lu, J., You, Z., et al. (2020). A generalized model for calculating the thermal conductivity of freezing soils based on soil components and frost heave. Int. J. Heat. Mass Transf. 150, 119166. doi:10.1016/j.ijheatmasstransfer.2019.119166
Brandes, H. G. (2010). Simple shear behavior of calcareous and quartz sands. Geotech. Geol. Eng. 29 (1), 113–126. doi:10.1007/s10706-010-9357-x
Carraro, J. A. H., and Bortolotto, M. S. (2015). Stiffness degradation and damping of carbonate and silica sands, Proceedings of the Frontiers in offshore geotechnics III. Oslo, Norway, 1179–1183.
Catano, J., and Pando, M. A. (2010). Static and dynamic properties of a calcareous sand from southwest Puerto RicoProc. Adv. Analysis, Orlando, USA: Modeling & Design, 842–851.
Coop, M. R., Sorensen, K. K., Bodas Freitas, T., and Georgoutsos, G. (2004). Particle breakage during shearing of a carbonate sand. Geotechnique 54 (3), 157–163. doi:10.1680/geot.2004.54.3.157
Cudmani, R. (2000). Statische, Alternierende und Dynamische Penetration in Nichtbindigen Böden. Doctor. Karlsruhe: Universitat Fridzu Karlsruhe TH.
Foray, P. Y., Nauroy, J. F., and Colliat, J. L. (1999). Mechanisms governing the behaviour of carbonate sands and influence on the design of deep foundation, Proceedings of the Engineering for calcareous sediments. Bahrain, Febr. 21-24, 55–68.
Giang, P. H. H., Impe, P. V., Impe, W. F. V., Menge, P., and Haegeman, W. (2015). Effects of grain size distribution on the initial small strain shear modulus of calcareous sand. Proc. XVI ECSMGE Geotechnical Eng. Infrastructure Dev. Edingburgh, U. K. Sept. 13-17, 3177–3182.
Hassanlourad, M., Rasouli, M. R., and Salehzadeh, H. (2014). A comparison between the undrained shear behavior of carbonate and quartz sands. Int. J. Civ. Eng. 12 (4), 338–350.
Hyodd, M., Hyde, A. F. L., and Aramaki, N. (1998). Liquefaction of crushable soils. Geotechnique 48 (4), 527–543. doi:10.1680/geot.1998.48.4.527
LaVielle, T. H. (2008). Liquefaction susceptibility of uncemented calcareous sands from Puerto Rico by cyclic triaxial testing Master. Blacksburg: Virginia Polytechnic Institute and State University.
Liu, H. T., Sun, L. Z., and Ju, J. W. (2006). Elastoplastic modeling of progressive interfacial debonding for particle-reinforced metal-matrix composites. Acta Mech. 181 (1-2), 1–17. doi:10.1007/s00707-005-0279-2
Liu, N., Li, N., Li, G., Song, Z., Wang, S., and Wang, S. (2022). Method for evaluating the equivalent thermal conductivity of a freezing rock mass containing systematic fractures. Rock Mech. Rock Eng. 55, 7333–7355. doi:10.1007/s00603-022-03038-9
Liu, N., Li, N., Wang, S., Li, G., and Song, Z. (2023). A fully coupled thermo-hydro-mechanical model for fractured rock masses in cold regions. Cold Reg. Sci. Technol. 205, 103707. doi:10.1016/j.coldregions.2022.103707
Liu, N., Li, N., Xu, C., Li, G., Song, Z., and Yang, F. (2020a). Mechanism of secondary lining cracking and its simulation for the Dugongling tunnel. Rock Mech. Rock Eng. 53 (9), 4539–4558. doi:10.1007/s00603-020-02183-3
Liu, X., Ni, C., Meng, K., Zhang, L., Liu, D., and Sun, L. (2020b). Strengthening mechanism of lightweight cellular concrete filled with fly ash. Constr. Build. Mat. 251, 118954. doi:10.1016/j.conbuildmat.2020.118954
Lv, Y., Wang, Y., and Zuo, D. (2019). Effects of particle size on dynamic constitutive relation and energy absorption of calcareous sand. Powder Technol. 356, 21–30. doi:10.1016/j.powtec.2019.07.088
Matsushima, T., Katagiri, J., Uesugi, K., Tsuchiyama, A., and Nakano, T. (2009). 3D shape characterization and image-based DEM simulation of the lunar soil simulant FJS-1. J. Aerosp. Eng. 22 (1), 15–23. doi:10.1061//asce/0893-1321/2009/22:1/15
Ministry of Housing and Urban-Rural Development of the People's Republic of China (2009)). Code for Investugation of geotechnical engineering, GB 50021-2009. Beijing, China: China Construction Industry Press.
Ministry of Housing and Urban-Rural Development of the People's Republic of China (2016). Code for seismic design of Buildings, GB 50011-2010. Beijing, China: China Construction Industry Press, 23–25.
Morsy, A. M., Salem, M. A., and Elmamlouk, H. H. (2019). Evaluation of dynamic properties of calcareous sands in Egypt at small and medium shear strain ranges. Soil Dyn. Earthq. Eng. 116, 692–708. doi:10.1016/j.soildyn.2018.09.030
Osamu, K. (2020). Technical standards and commentaries for port and harbour facilities in Japan. Tokyo, Japan: The Overseas Coastal Area Development Institute of Japan, 322–326.
Pando, M. A., Sandoval, E. A., and Catano, J. (2012). Proceedings of the 15 world conference on earthquake engineering. Lisbon, Portugal–28. 24.Liquefaction susceptibility and dynamic properties of calcareous sands from Cabo Rojo, Puerto RicoSeptember.
Robertson, P. K., and Wride, C. E. (1998). Evaluating cyclic liquefaction potential using the cone penetration test. Can. Geotech. J. 35, 442–459. doi:10.1139/t98-017
Seed, H. B., and Idriss, I. M. (1971). Simplified procedure for evaluating soil liquefaction potential. J. Soil Mech. Found. Div. 97 (9), 1249–1273. doi:10.1061/jsfeaq.0001662
Seneviratne, C., Gunasekara, C., Law, D. W., Setunge, S., and Robert, D. (2020). Creep, shrinkage and permeation characteristics of geopolymer aggregate concrete: Long-term performance. Arch. Civ. Mech. Eng. 20 (4), 140. doi:10.1007/s43452-020-00119-w
Shahnazari, H., Jafarian, Y., Tutunchian, M. A., and Rezvani, R. (2016). Probabilistic assessment of liquefaction occurrence in calcareous fill materials of kawaihae harbor, Hawaii. Int. J. Geomech. 16 (6), 05016001. doi:10.1061/(asce)gm.1943-5622.0000621
Shih, T. C., Chen, J. H., Liu, D., Nie, K., Sun, L., Lin, M., et al. (2010). Computational simulation of breast compression based on segmented breast and fibroglandular tissues on magnetic resonance images. Phys. Med. Biol. 55 (14), 4153–4168. doi:10.1088/0031-9155/55/14/013
Tang, G., Xia, Y., and Liu, Z. (2013). Engineering behavior of coral sands in Dili, Timor-Leste. Chin. Geotech. Eng. Tech. 27 (5), 248–251.
Terzaghi, K., and Peck, R. B. (1967). Soil mechanics in engineering practice. 2nd ed. USA, New York: John Wiley & Sons.
Wang, L. L., Bornert, M., Héripré, E., Chanchole, S., Pouya, A., and Halphen, B. (2015). The mechanisms of deformation and damage of mudstones: A micro-scale study combining esem and dic. Rock Mech. Rock Eng. 48, 1913–1926. doi:10.1007/s00603-014-0670-1
Wang, X., Jiao, Y., Wang, R., Hu, M., Meng, Q., and Tan, F. (2011). Engineering characteristics of the calcareous sand in nansha Islands, South China Sea. Eng. Geol. 120 (1-4), 40–47. doi:10.1016/j.enggeo.2011.03.011
Wang, X., Tan, F., Jiao, Y., and Wang, R. (2014). A new apparatus for testing the bearing capacity of calcareous sand in laboratory. Mar. Georesources Geotechnol. 32 (4), 379–386. doi:10.1080/1064119x.2012.728683
Wang, X., Weng, Y., Wei, H., Meng, Q., and Hu, M. (2019). Particle obstruction and crushing of dredged calcareous soil in the Nansha Islands, South China Sea. Eng. Geol. 261, 105274. doi:10.1016/j.enggeo.2019.105274
Wangsadinata, W. (2002). Seismic Resistant Design Standard for Building Structures Ministry of Housing and Regional Infrastructure in Cooperation with Japan, SNI-1726-2002. Indonesia: International Cooperation Agency: Jakarta-Bandung-Bali, 2–5.
Wu, Q., Ding, X., and Zhang, Y. (2022). Microfabric evolution of coral sand foundations during seismic liquefaction using 3D images. Soil Dyn. Earthq. Eng. 162, 107445. doi:10.1016/j.soildyn.2022.107445
Wu, W., Wang, R., Zhu, C., and Meng, Q. (2018). The effect of fly ash and silica fume on mechanical properties and durability of coral aggregate concrete. Constr. Build. Mat. 185, 69–78. doi:10.1016/j.conbuildmat.2018.06.097
Xiao, P., Liu, H., Xiao, Y., Stuedlein, A. W., and Evans, T. M. (2018). Liquefaction resistance of bio-cemented calcareous sand. Soil Dyn. Earthq. Eng. 107, 9–19. doi:10.1016/j.soildyn.2018.01.008
Yang, J., Xu, D., Shen, J., Wei, H., Wang, R., and Xiao, X. (2022). Effect of coral sand powders and seawater salinity on the impact mechanical properties of cemented coral sand. Soils Found. 62 (5), 101206. doi:10.1016/j.sandf.2022.101206
Zhang, Y., Liu, D., Chen, W., and Sun, L. (2022a). Microstructural analysis and multiscale modeling for stiffening and strengthening of consolidated earthen-site soils. J. Cult. Herit. 55, 143–148. doi:10.1016/j.culher.2022.03.005
Zhang, Y., Yang, G., Chen, W., and Sun, L. (2022b). Relation between microstructures and macroscopic mechanical properties of earthen-site soils. Materials 15 (17), 6124. doi:10.3390/ma15176124
Keywords: coral sand, microstructure, standard penetration resistance, grain-size distribution, liquefaction evaluation method
Citation: Ji Z, Ye X and Zhang Y (2023) Liquefaction evaluation method of coral sand: Case study on the ports in Indonesia. Front. Earth Sci. 10:1086250. doi: 10.3389/feart.2022.1086250
Received: 01 November 2022; Accepted: 05 December 2022;
Published: 16 January 2023.
Edited by:
Naifei Liu, Xi’an University of Architecture and Technology, ChinaReviewed by:
Jiawei Jiang, Nanjing Tech University, ChinaWujian Yan, Lanzhou Earthquake Research Institute, China Earthquake Administration, China
Copyright © 2023 Ji, Ye and Zhang. This is an open-access article distributed under the terms of the Creative Commons Attribution License (CC BY). The use, distribution or reproduction in other forums is permitted, provided the original author(s) and the copyright owner(s) are credited and that the original publication in this journal is cited, in accordance with accepted academic practice. No use, distribution or reproduction is permitted which does not comply with these terms.
*Correspondence: Zezhou Ji, jizezhou@fdine.net; Yingmin Zhang, zhangym16@outlook.com