Disassociation of the Kuroshio Current with the Pacific Decadal Oscillation Since 1999


1
Department of Earth Sciences, National Taiwan Normal University, Taipei 116, Taiwan
2
Horn Point Laboratory, University of Maryland Center for Environmental Science, Cambridge, MD 21613, USA
*
Author to whom correspondence should be addressed.
Remote Sens. 2019, 11(3), 276; https://doi.org/10.3390/rs11030276
Submission received: 4 January 2019
/
Revised: 24 January 2019
/
Accepted: 27 January 2019
/
Published: 31 January 2019
(This article belongs to the Section Ocean Remote Sensing)
Abstract
:Variability of the Kuroshio Current along the margin of the East China Sea was examined using principal component analysis of 21-year (1993–2013) multi-satellite geostrophic velocity data. Its seasonal zonal migration agrees with previous observations and model simulations. Beyond seasonal time scales, the influence of the Pacific Decadal Oscillation (PDO) on the Kuroshio decreased considerably since 1999. Wind patterns over the North Pacific varied primarily in the meridional direction before 1999, but exhibited strong zonal variation thereafter. Post-1998 climate variability was particularly evident over the central and eastern Pacific. The strong association between PDO and Kuroshio variability also deteriorated after that time.

1. Introduction
The Kuroshio Current enters the East China Sea (ECS) through the passage between Taiwan and Yonaguni Island at the southwestern tip of the Ryukyu Islands (Figure 1a). Thereafter, its axis generally follows the 200 m isobath northeastward [1,2], eventually exiting the ECS through Tokara Strait [3,4,5]. Satellite-derived surface geostrophic velocity can be used to track variability of the Kuroshio in this area [5]. Herein, we refer to surface geostrophic current variability along this stretch of the main stream as Kuroshio-ECS. Observations and model simulations support a seasonal shift of the Kuroshio axis, migrating seaward in the summer and shoreward in the winter [6,7,8,9]. Seasonal fluctuations of Kuroshio intensity and its zonal migration modulate nutrient fluxes into the ECS and local fisheries [4,6,10].
Beyond seasonal variation, the Kuroshio-ECS also exhibits interannual variations. Previous studies attributed this interannual variability to the El Niño–Southern Oscillation (ENSO), which has global effects [11]. However, more recent studies demonstrated that the interannual variability of Kuroshio intensity, as inferred from satellite altimetry data, is correlated more closely with the Pacific Decadal Oscillation (PDO) than with ENSO [12,13]. In general, Kuroshio intensity inferred from the sea-level difference across the Kuroshio is stronger (weaker) during positive (negative) PDO periods [12,13,14], at least before 1999. The PDO, which is derived from long-term basin-wide sea surface temperature (SST) variations, is a good proxy for the overlying wind field and the wind stress curl (WSC) distribution [15,16,17,18,19]. The close link between Kuroshio-ECS and PDO, therefore, also suggests a possible strong link to the WSC distribution [12,13,20,21,22]. The recent analysis by Andres et al. [22] supported this link, yielding a modest correlation (R = −0.54). In that study, the barotropic transport variability of the Kuroshio-ECS was correlated with WSC anomalies over the open ocean. The barotropic response of the Kuroshio-ECS appeared related to a dipolar structure in WSC anomalies, with one pole centered on the ECS latitudes and the other located farther north. Their study did not distinguish between observations before and after 1998. The post-1998 era is of interest to the present study.
The influence of the PDO on Kuroshio-ECS variability may have a limit. Historically, either the positive (warm) or negative (cold) PDO phase could persist for decades [15,17,19]. A phase change of the PDO is relevant to various physical processes, such as ENSO teleconnections, the atmospheric bridge from the Indian Ocean, Atlantic Multidecadal Oscillation (AMO) teleconnections, variability of the Kuroshio–Oyashio Extension, and local atmosphere–ocean interactions [15,16,23,24]. Since the late 1990s, the PDO phase shifted to a cool regime, and this swing might have resulted in the so-called global warming hiatus [25,26,27,28]. The PDO phase change might have impacted the wind field and ocean circulation at the basin scale to some extent, as supported by Nakamura et al. [29], who noted that the PDO explains little of the Kuroshio-ECS variability after 2000. Soeyanto et al. [30] also observed a decreased correlation after 2002. They further attributed this trend to eddy activity, and pointed out that the eddy had less effect on the northern segment (downstream) of the Kuroshio-ECS because of the presence of islands between Okinawa Island and Tokara Strait. Owing to island blocking, the Kuroshio at different latitudes behaved differently to westward-propagating signals. For example, wind-induced variations at given latitudes south of 26°N were merged into the upstream Kuroshio northeast of Taiwan and advected downstream [31], but they could not be directly merged into the Kuroshio at ECS latitudes (26–29°N) due to blocking of the Ryukyu islands [32].
The present investigation provides an updated view of the phenomenon. The PDO exerted less influence on Kuroshio-ECS since 1999 where, in terms of the sea surface temperature anomalies (SSTA) and wind stress patterns that drive the PDO index, the principal empirical orthogonal function (EOF) mode of the North Pacific SSTA began resembling the second mode. The consequence of this mode change is the focus of our investigation. Section 2 briefly describes the datasets and methods used in this study. The results are described and discussed in Section 3, and summarized in Section 4.
2. Materials and Methods
Gridded multi-satellite geostrophic velocity (GSV) data, derived from Maps of Absolute Dynamic Topography (MADT) provided by AVISO (Archiving, Validation, and Interpretation of Satellite Oceanographic data) [33], were used to describe the surface flow pattern. MADT is the sum of satellite altimeter-based sea level anomalies and mean dynamic topography, calculated from in situ datasets and a geoid model [33]. Daily data are available from January 1993 to December 2013 with a spatial resolution of 1/4°, and were converted to monthly averages after downloading. GSV is generally equivalent to transport (or barotropic flow), as described by Gordon and Giulivi [14], Han and Huang [12], and Andres et al. [22]. Andres et al. [13] used a similar empirical formula to estimate Kuroshio transport. GSV data were validated using shipboard acoustic Doppler current profiler (sb-ADCP) composite data, and the two datasets yielded quite similar mean flow patterns [34]. Surface winds were taken from the National Centers for Environmental Prediction/National Center for Atmospheric Research (NCEP/NCAR) reanalysis project. Monthly averages of the global grids (1.875° × 1.875°) are available from the Physical Sciences Division of the National Oceanic and Atmospheric Administration’s Earth System Research Laboratory (NOAA/ESRL). Monthly SST imagery from 1900 to 2013, with a resolution of 2° × 2°, are the product of Extended Reconstructed SST (ERSSTv.3b), and are also distributed by NOAA/ESRL. Pearson correlations, t-test, and n − 2 degrees of freedom (where n is sample size) were used to calculate the correlation coefficient. Anomaly values were calculated by removing the annual climatological cycle. The Monte Carlo permutation test [35] was applied to evaluate the significance of time-dependent correlations. The time-dependent correlation was obtained by calculating the correlation between two time series using a two-year window.
3. Results
3.1. Principal Component Analysis of the Kuroshio-ECS
Satellite altimeter-derived GSVs from January 1993 to December 2013 were examined in terms of EOF using principal component analysis. The annual climatological cycle and long-term trend over the period 1993–2013 were removed before applying EOF. The zonal component (U) and meridional component (V) can be combined to form a scalar GSV in the form of . The first EOF mode of the scalar GSV accounted for 22% of the total variance. This leading mode served as a good proxy for the dominant variability, despite it not including all variations of the Kuroshio GSV. Figure 1a shows the spatial pattern of the first EOF mode of the scalar GSV. In this figure, the shelf break along the 200-m isobath no longer follows the axis of Kuroshio due to modal decomposition. Nevertheless, it serves as an approximate nodal line separating large-amplitude oscillations of opposite signs, with positive values to its east and negative values to its west. The time series of the first GSV mode also reveals significant year-to-year variation (black curve in Figure 1b). Major peaks at periods of around 2.1 years and longer than five years are often seen in spectral analyses of the mode 1 coefficient (Figure S1, Supplementary Materials), and these two periods were noted in previous analyses of sea-level-based Kuroshio variability [36].
Combining the spatial pattern and time series of the first mode (Figure 1a,b), the Kuroshio-ECS is stronger during the positive phase (see also Figure S2, Supplementary Materials). Furthermore, stronger (weaker) Kuroshio velocities accompany seaward (shoreward) movement of the Kuroshio-ESC axis. Thus, the first EOF mode captures documented Kuroshio path variations estimated from geomagnetic electrokinetograph measurements [37] and modeling studies [6].
The PDO index was provided by the JISAO (Joint Institute for the Study of the Atmosphere and Ocean, http://research.jisao.washington.edu/pdo/), and was defined as the first EOF mode of long-term (1900–2013) SSTA over the North Pacific (north of 20°N) [19]. Whether this long-term index can represent modern ocean conditions since 1999 is examined below. We superimpose a 13-month running average time series of the monthly PDO index (thick green curve) in Figure 1b to illustrate its relation to Kuroshio variability (thick black curve). The visual coherence between the PDO index and the first EOF mode time series of Kuroshio-ECS was high before 1999, but deteriorated thereafter. Without excluding the unstable PDO changes since 1999, the interannual fluctuations of Kuroshio-ECS intensity are still linked to phase changes of the PDO to some degree [12,13]. In particular, Kuroshio intensity still tends to increase with positive PDO and decrease with negative PDO [12]. However, separating the two periods sharpens the contrast. To better quantify this relationship, the overall correlation coefficient (R) between PDO and the first EOF mode of Kuroshio-ECS was only 0.17 for 1993–2013. Separating the two periods, the correlation coefficient was 0.41 (above the 99% confidence level, sample size was 72) for 1993–1998, but dropped to 0.03 (below the 90% confidence level, sample size was 180) for 1999–2013.
To further quantify the relationship between PDO and Kuroshio-ECS, we calculated their time-varying correlation using a two-year running window. Figure 1c shows the resulting time series of the correlation coefficient (R). A highly positive correlation was persistent before 1999, but became intermittent and statistically insignificant thereafter. The following independent analysis further bears out the findings presented in Figure 1c. A correlation map between the original monthly GSV and PDO is shown in Figure 2. There is a pronounced positive correlation (up to 0.6) along the Kuroshio in the ECS, accompanied by a negative correlation over the shelf during 1993–1998 (Figure 2a), although the correlation is not significant south of 26°N, resulting from mesoscale eddy activities [30]. In other words, the PDO and associated basin-wide WSC determined the Kuroshio’s intensity along the ECS in 1993–1998. Thereafter, the tight correlation deteriorated (Figure 2b), in accordance with Figure 1c. Since 1999, the PDO no longer represents the prevailing climate conditions that affect the strength of Kuroshio-ECS.
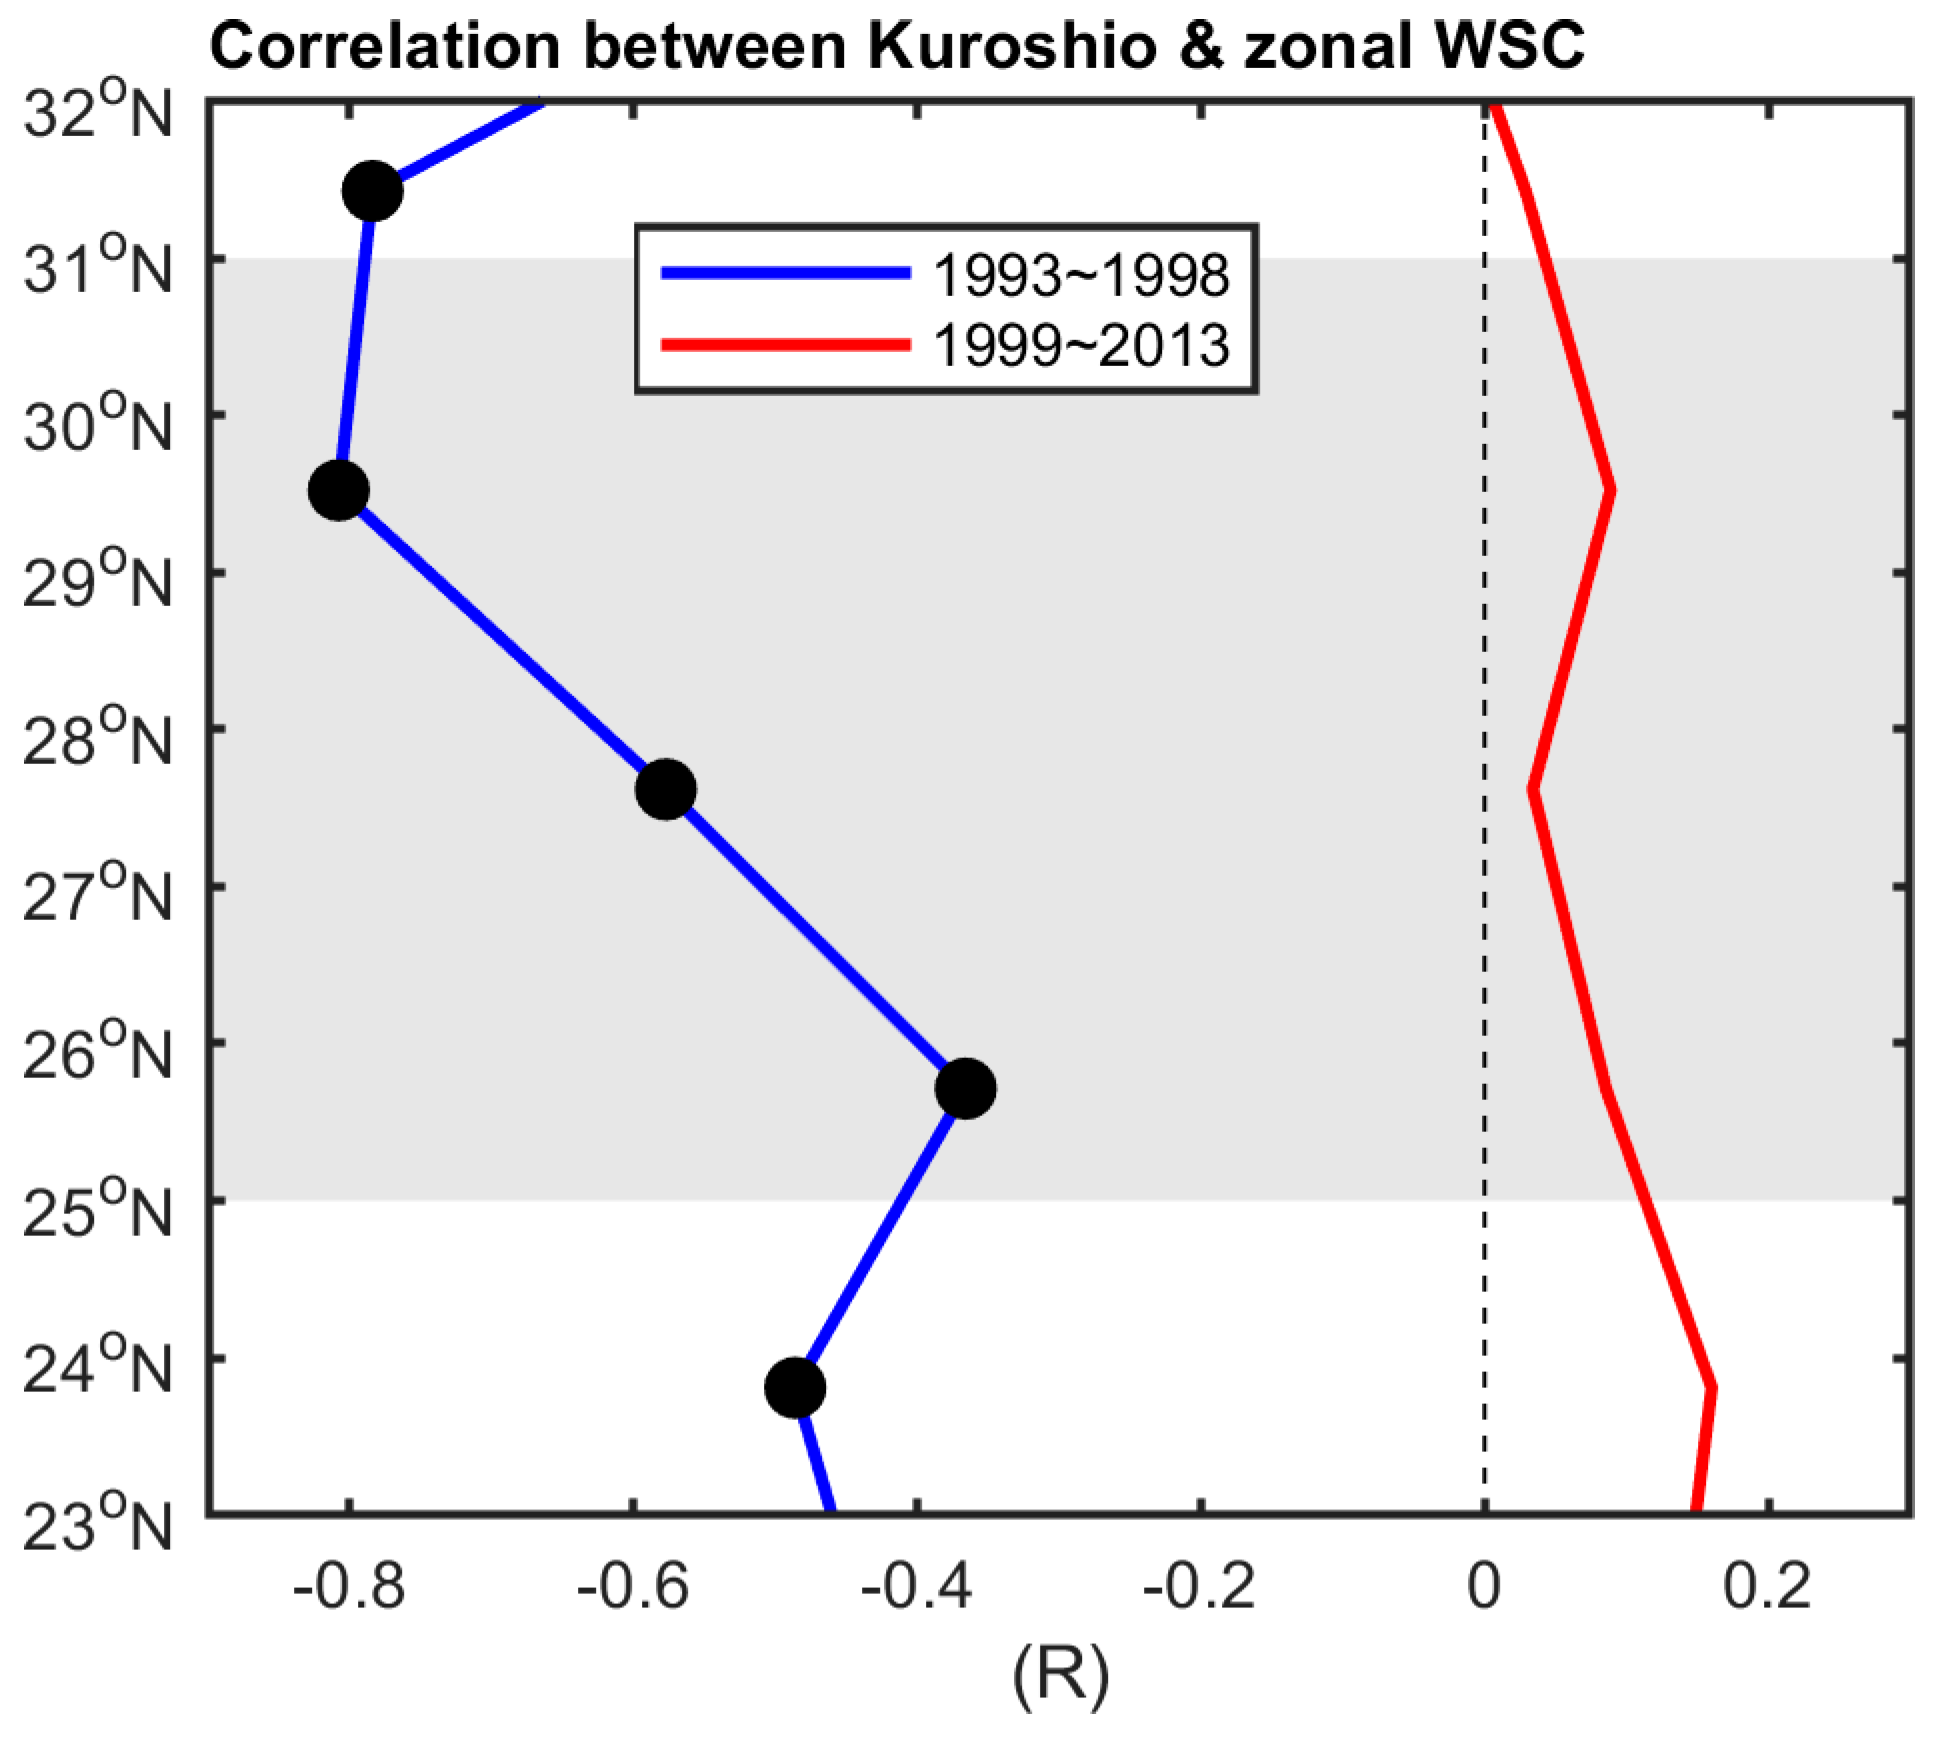
Gordon and Giulivi [14] demonstrated that changes in the geostrophic intensity of the Kuroshio are closely related to PDO. During the positive PDO phase, strengthened westerlies over the North Pacific induce greater Kuroshio intensity. Our investigation confirms a connection between PDO and the mid-latitude westerlies (and the associated Kuroshio-ECS) prior to 1999. We further calculated basin-scale WSC to investigate the variability of the Kuroshio-ECS during 1999–2013. Figure 3 shows a comparison of the correlation between zonally averaged Pacific basin WSC and Kuroshio-ECS; the post-1998 era contributes heavily to the low correlation, which is not statistically significant (red curve in Figure 3). More specifically, the correlation coefficient was about −0.6 during 1993–1998, which agrees with previous findings of a strong tie between Kuroshio-ECS and the westerlies over the North Pacific [12,13,14]. The correlation decreases to about −0.15 (below the 99% confidence level) during 1999–2013, indicating the failure of the westerlies to dominate the circulation variability of the Kuroshio-ECS after 1998. The present study represents a departure from earlier arguments that PDO always dominates the atmospheric variability in the North Pacific, including the westerlies, which modulate the circulation of the Kuroshio-ECS. This mechanism has failed since 1999.
In lieu of westerlies, the Sverdrup balance may also reflect Kuroshio-ECS variability. The Sverdrup balance is defined as the zonal integral of the Sverdrup transport (WSC divided by meridional derivative of the Coriolis parameter) from the eastern boundary at a given grid point. Although Sverdrup transport derived from the WSC distributions provided a reasonable estimate during 1993–1998 (Figure 4a), it had a low correlation with Kuroshio variability during 1999–2013 (Figure 4b), indicating that zonally averaged WSC fails to represent Kuroshio-ECS circulation after 1999. In other words, the transport variability of the western boundary current in the area can be predicted by the Sverdrup balance only during 1993–1998, the period when PDO dominates the atmospheric variability in the North Pacific.
3.2. Leading Mode Succession
EOF analysis was applied to monthly SSTA over the North Pacific from 1900 to 2013, to produce an open-ocean version of the PDO. In this analysis, regions shallower than 200 m and within 5° of coasts were excluded from the EOF to focus on open-ocean variance. The two leading EOF modes accounted for 27.1% and 16.8% of the total variance. Figure 5a,b show the spatial patterns of the first and second EOF modes, respectively, of the North Pacific SSTA and the associated winds during 1900 to 2013. The first mode demonstrates large-amplitude oscillations occupying most of the North Pacific basin, with oscillations in the eastern basin that are out of phase with those in the western basin (Figure 5a). Both the spatial SSTA and wind patterns of the first model resemble the general PDO pattern [19]. Furthermore, the correlation between the time series of mode 1 and the PDO index is 0.9 with zero lag, as expected. Combining these spatial and temporal patterns, mode 1 is representative of the PDO. Arising from the first EOF mode of the same dataset, mode 1 excludes shallow and coastal areas, while PDO does not.
On the other hand, mode 2 is mainly driven by oscillations centered at 30–35°N, 170°E–160°W in the southwestern basin and oscillations centered at 40–50°N, 140–160°W in the northeastern basin (Figure 5b). The spatial pattern of mode 2 somewhat resembles the North Pacific Gyre Oscillation (NPGO) mode of the climate variability. The NPGO was envisioned from analysis of Northeast Pacific SST and sea surface height anomalies over the region (180–110°W; 25–62°N) [38]. To facilitate the discussion below, we use the terms Type-A (PDO-like, Figure 5a) and Type-B (northeast-southwest dipole, Figure 5b) to represent mode 1 and mode 2 of the North Pacific SSTA for 1900–2013.
Since the late 1990s, the rate of global warming entered a slowing or quasi-stationary state despite increases in atmospheric greenhouse gases [25,26,27,28,39,40]. Increased climate variability was also observed in the Pacific. North Pacific SSTs in 1999–2013 exhibited an anomalous cold phase over the central and eastern Pacific and warming over the western Pacific compared to temperatures in 1993–1998 (Figure S3, Supplementary Materials). Isolating the period from 1999 to 2013 for reanalysis of EOF, the leading mode of SSTA changes. The new first EOF mode (1999–2013 SSTA) resembles Type-B. This alteration of the leading mode is not a switch from Type-A to Type-B; the resemblance between the new second mode and Type-A is less than marginal (Figure S4, Supplementary Materials). We refer to this change as “leading mode succession”.
Removing the anomalous period from 1999 to 2013, we firstly applied EOF analysis to monthly SSTA over the North Pacific for the normal period of 1993 to 1998. Regions shallower than 200 m and within 5° of coasts were excluded to accentuate variance in the open ocean. The first SSTA mode accounts for 33.4% of the total variance. Figure S5a (Supplementary Materials) shows the spatial pattern of the first mode with color shading. The associated first mode EOF time series of SSTA (black curve in Figure S5b, Supplementary Materials) includes positive (warm) and negative (cool) periods, which are essentially in phase with the positive and negative periods of PDO (green curve in Figure S5b, Supplementary Materials).
Positive (negative) PDO is often referred to as a warm (cold) period due to its association with temperature anomaly in the tropics. In our latitudes of interest, shown in Figure 1a, the temperature anomaly is generally the opposite of that of tropics, with positive (negative) PDO predominantly being cold (warm). In Figure S5b (Supplementary Materials), the correlation coefficient between PDO and the first mode of SSTA is 0.75, and is above the 99% confidence level.
Historically (prior to 1999), westerlies tended to strengthen during positive PDO (also seen in Figure 5a) [16,17,18,19]. This tendency provides a crucial clue as to why the Kuroshio failed to follow the PDO since 1999. According to the classical paradigm, the Aleutian Low becomes deeper and shifts to the south during a positive PDO; westerlies over the North Pacific and, hence, the Kuroshio strengthen accordingly [14,16,17,19]. This was true before 1999. We illustrate below that the westerlies intensified during positive PDOs from 1993 to 1998. The PDO in 1993–1998 was generally positive (Figure S5b, Supplementary Materials). In Figure S5a (Supplementary Materials), mode 1 SSTA, represented by color, is characterized by an expansive tongue of cold anomaly stretching eastward between 20°N and 45°N, surrounded by a thin, horseshoe-shaped warm anomaly opening to the west. Interestingly, the cold tongue appears to provide a boundary for the westerly wind intensification during positive PDOs. Conversely, one could also argue that the enhanced westerlies reduce SST. The corresponding first EOF mode of the sea level pressure (SLP) anomaly is similar in structure and can be used as an alternative proxy to produce an index similar to PDO [16].
The meridional profile of the anomalous westerly wind is more informative, as shown in Figure S5a (Supplementary Materials). Diminishing from about 38°N southward (to 20°N), it imparts additional negative WSC to the ocean (Figure S5c, Supplementary Materials). If the classical theory of western intensification [41] holds, the westerly wind anomaly during positive PDO would strengthen the Kuroshio. This helps explain why the Kuroshio strengthened during positive PDO prior to 1999 (Figure 1b).
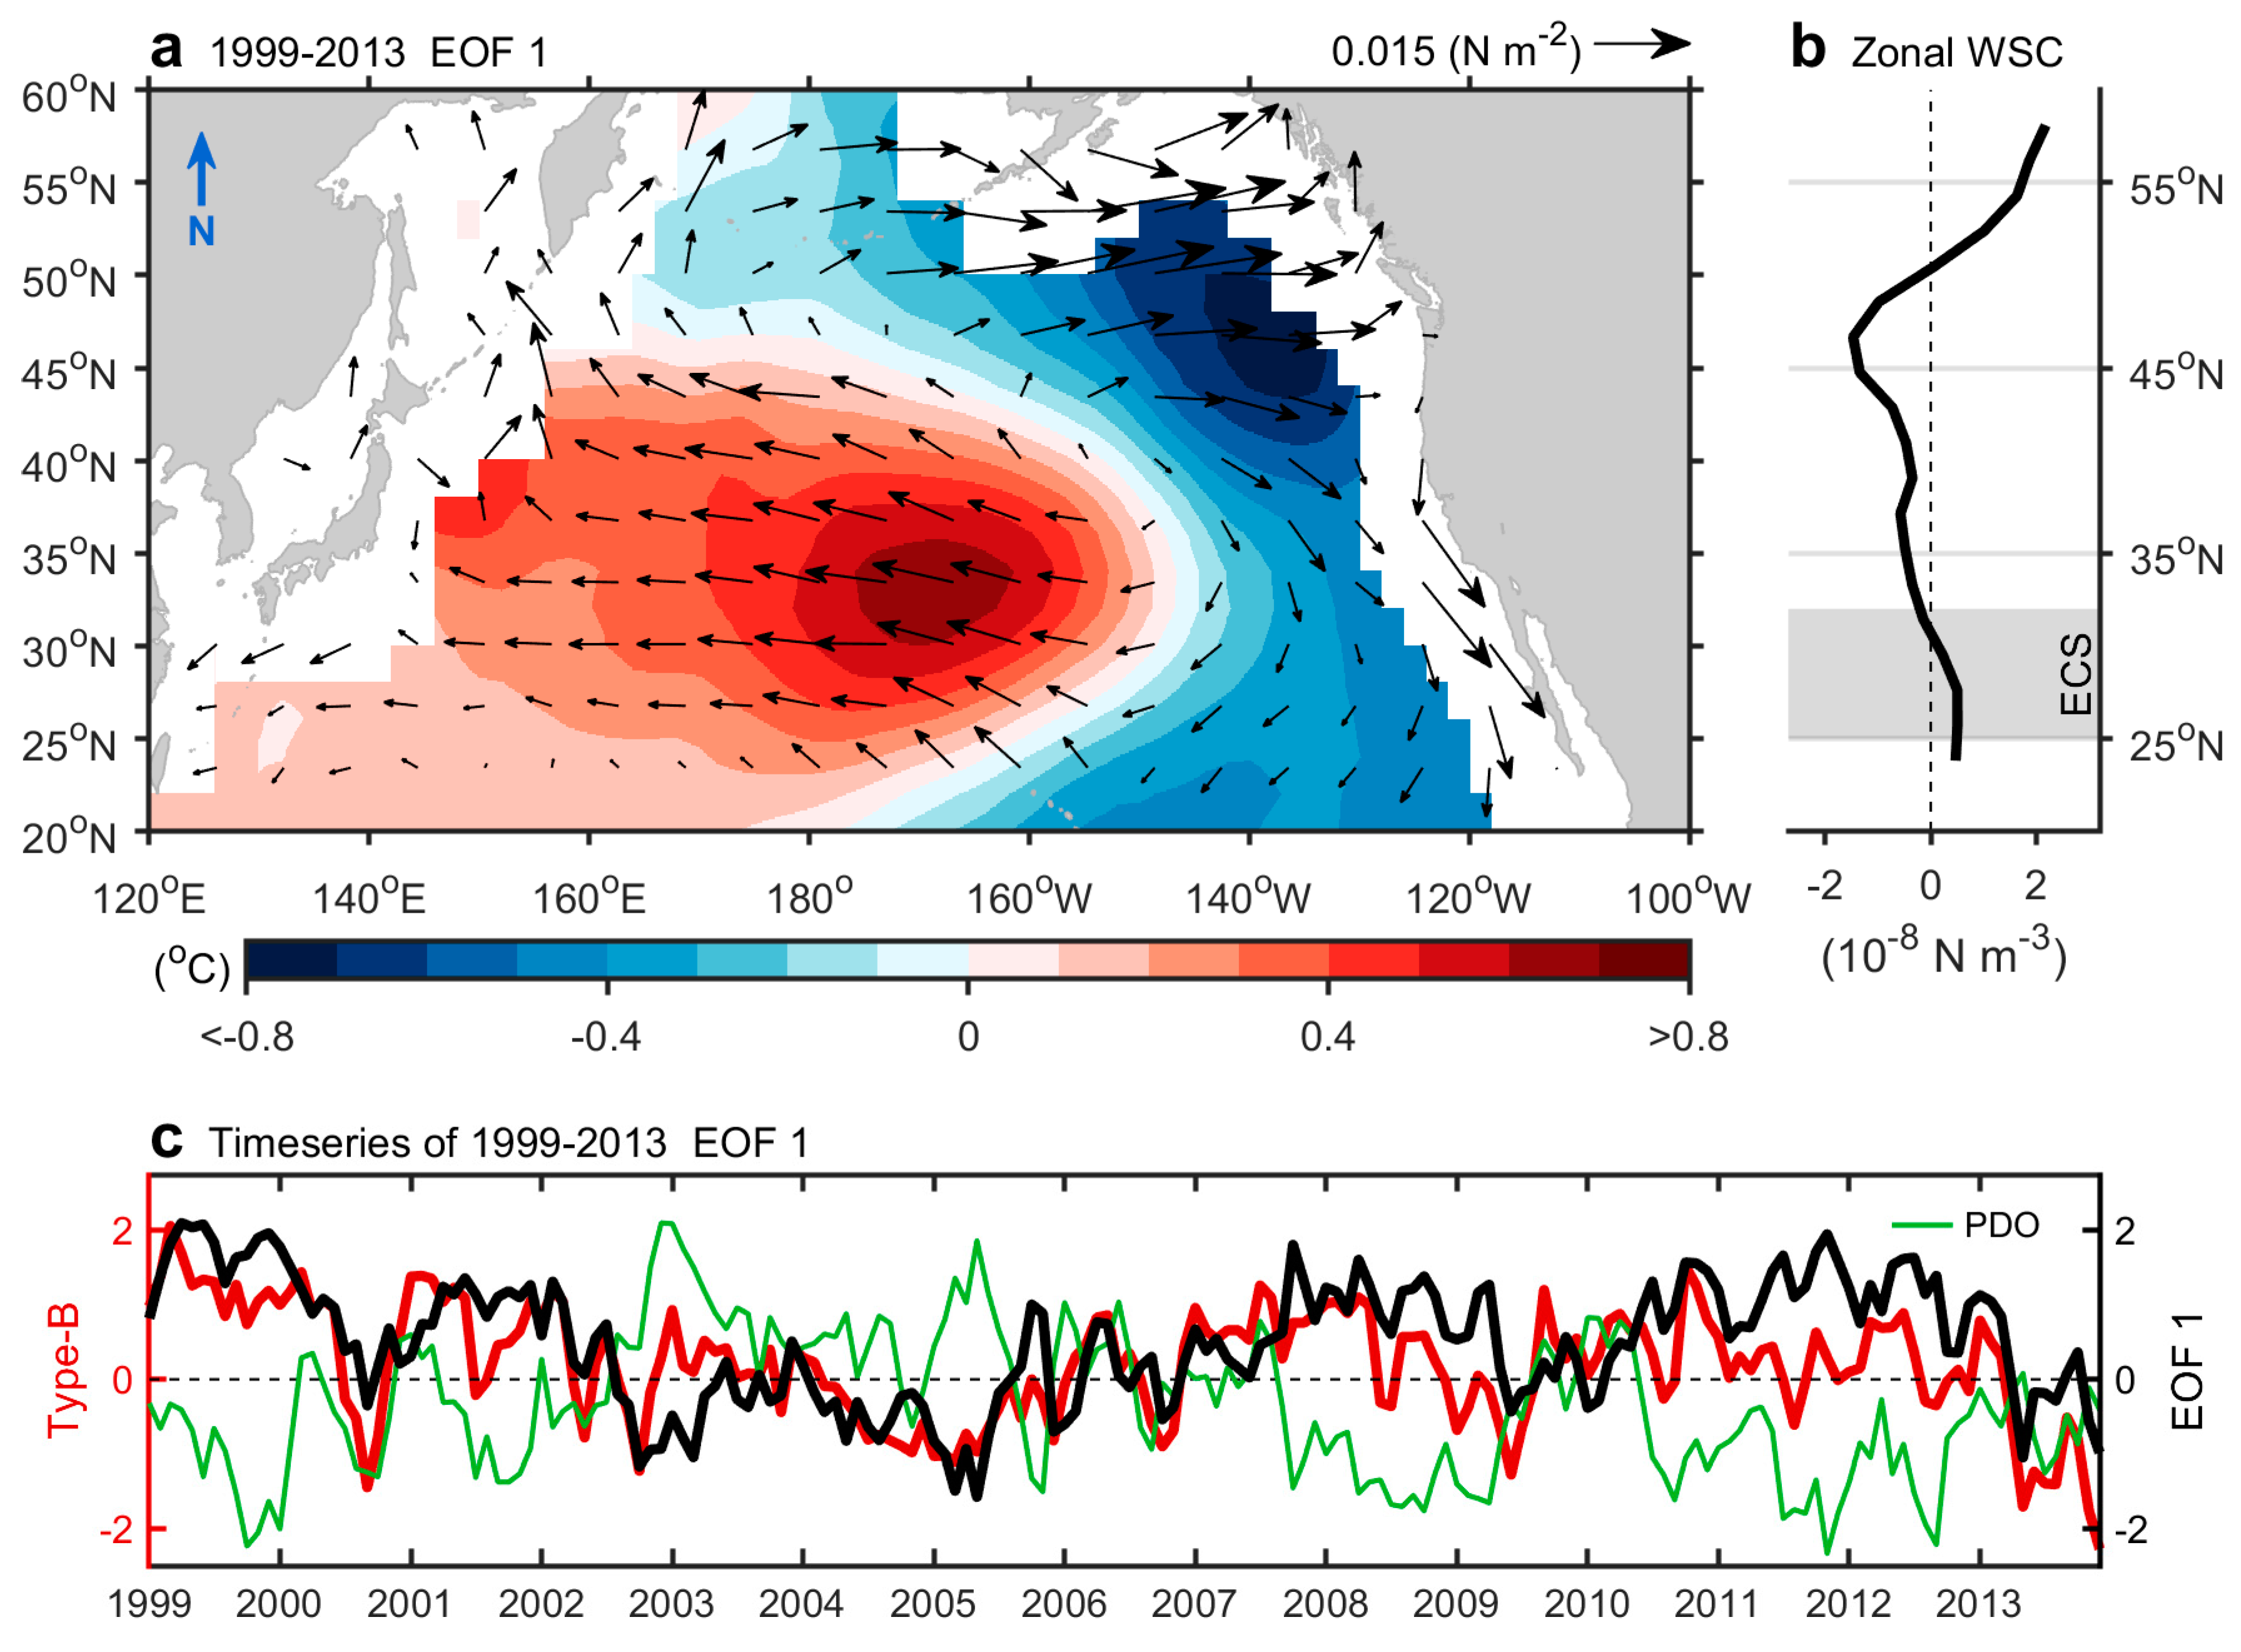
Beginning in 1999–2013, Type-A (PDO-like) was no longer representative of the first EOF mode of SSTA. Figure 6a shows the spatial pattern of the first SSTA mode during 1999–2013, which accounts for 24.6% of the total variance. The first mode of SSTA became dipolar during this period, with a bloated warm anomaly over the central North Pacific between 25°N and 40°N and a cold anomaly off the United States (US) coastline from northern California to Washington. The conventional (generally uniform zonally, but meridionally variable) SSTA close to the western boundary of the North Pacific present before 1999 was replaced by SSTA that mostly varies zonally in the central and eastern North Pacific thereafter, which is somewhat remote from the Kuroshio main stream. Pronounced changes in surface winds after 1999 are also evident. Compared to Figure S5c (Supplementary Materials), WSC anomalies over the Kuroshio-ECS region are insignificant, indicating that Kuroshio-ECS variability after 1999 was less dependent on the prevailing winds. The correlation between the 1999–2013 first mode and the WSC in the latitude of Kuroshio-ECS (gray shading in Figure 6b) is low (0.13, below the 90% confidence level, sample size was 180). Interestingly, a similar dipole distribution was observed much earlier as the North Pacific Oscillation (NPO) in SLP variations [42], and subsequently as the second EOF mode of SLP variability over the North Pacific [43].
In Figure 6c, the time series of the first SSTA mode (black curve) does not correlate well with the PDO index (green curve). This indicates that a climate signature other than PDO, however elusive, replaces PDO in representing the overlying atmospheric wind field. The year 1999 appears to trigger leading mode succession in the North Pacific. The time series of Type-B is superimposed in Figure 6c (red curve). It is nearly in phase with the dominant mode 1 time series of SSTA for most of the period 1999–2013, with a correlation of 0.81 (greater than the 99% confidence level). Therefore, Type-B replaces Type-A (PDO-like) as representative of North Pacific climate variability for the unstable period of 1999–2013. During this period, the correlation between Type-A and the first SSTA mode decreased, while Type-B reinforced its effect on SSTA and, hence, the wind pattern in the North Pacific, as shown in Figure 6. Because PDO (Type-A) and Type-B successively impact the wind pattern and reflect the circulation pattern of the Kuroshio-ECS before and after 1999, their relative importance can be assessed using a linear regression model [44], stated as
or
where T represents the normalized time series of the first SSTA mode over the North Pacific during a specific period, P and TypeB are the normalized PDO index and Type-B time series, respectively, n is time (in months), and ε represents unexplained noise. The monthly time series yn, ranging between a minimum (min) and a maximum (max), is normalized according to (yn − min)/(max − min), such that it varies between 0 and 1. Applying the regression to 1993–1998, we found α = 0.71 and β = −0.46 (error variance was 0.011, statistically significant above the 99% confidence level), indicating that PDO is the dominant factor driving climate variability during the first period. For 1999–2013, we obtained α = −0.59 and β = 1.02 (error variance was 0.004, statistically significant above the 99% confidence level), suggesting a two-fold preference of Type-B over PDO. After leading mode succession in 1999, the climate conditions favored Type-B to replace PDO. Because the overlying wind field was altered since 1999, the Kuroshio-ECS should shift away from PDO control. As the Type-B influence increases, is it sufficient to replace PDO? In terms of the prognostic ability to index Kuroshio-ECS, the answer is no. This finding is discussed further in Section 3.3.
T = α × P + β × TypeB + ε,
3.3. Baroclinic Responses
Because PDO is no longer predictive of Kuroshio-ECS, is there an alternative index for this unstable period? Type-A may be replaced by Type-B, which indexed the new leading mode of the North Pacific SSTA reasonably well since 1999 (Figure 6). Because the overlying wind field changed to Type-B climate conditions since 1999, we tested the correlation between the time series of the westerlies and Type-B. It turns out that these two time series are poorly correlated. The correlation coefficient was −0.16 in 1999–2013, lower than the 99% significance level. The major signature of Type-B is a strong dipole structure in the central and northeastern Pacific that is generally remote from Kuroshio-ECS. As major SSTA features drift farther eastward, the Kuroshio-ECS is losing its sensitivity to SSTA. This remoteness may explain why Type-B indexes SSTA well, but fails to represent changes in the westerlies.
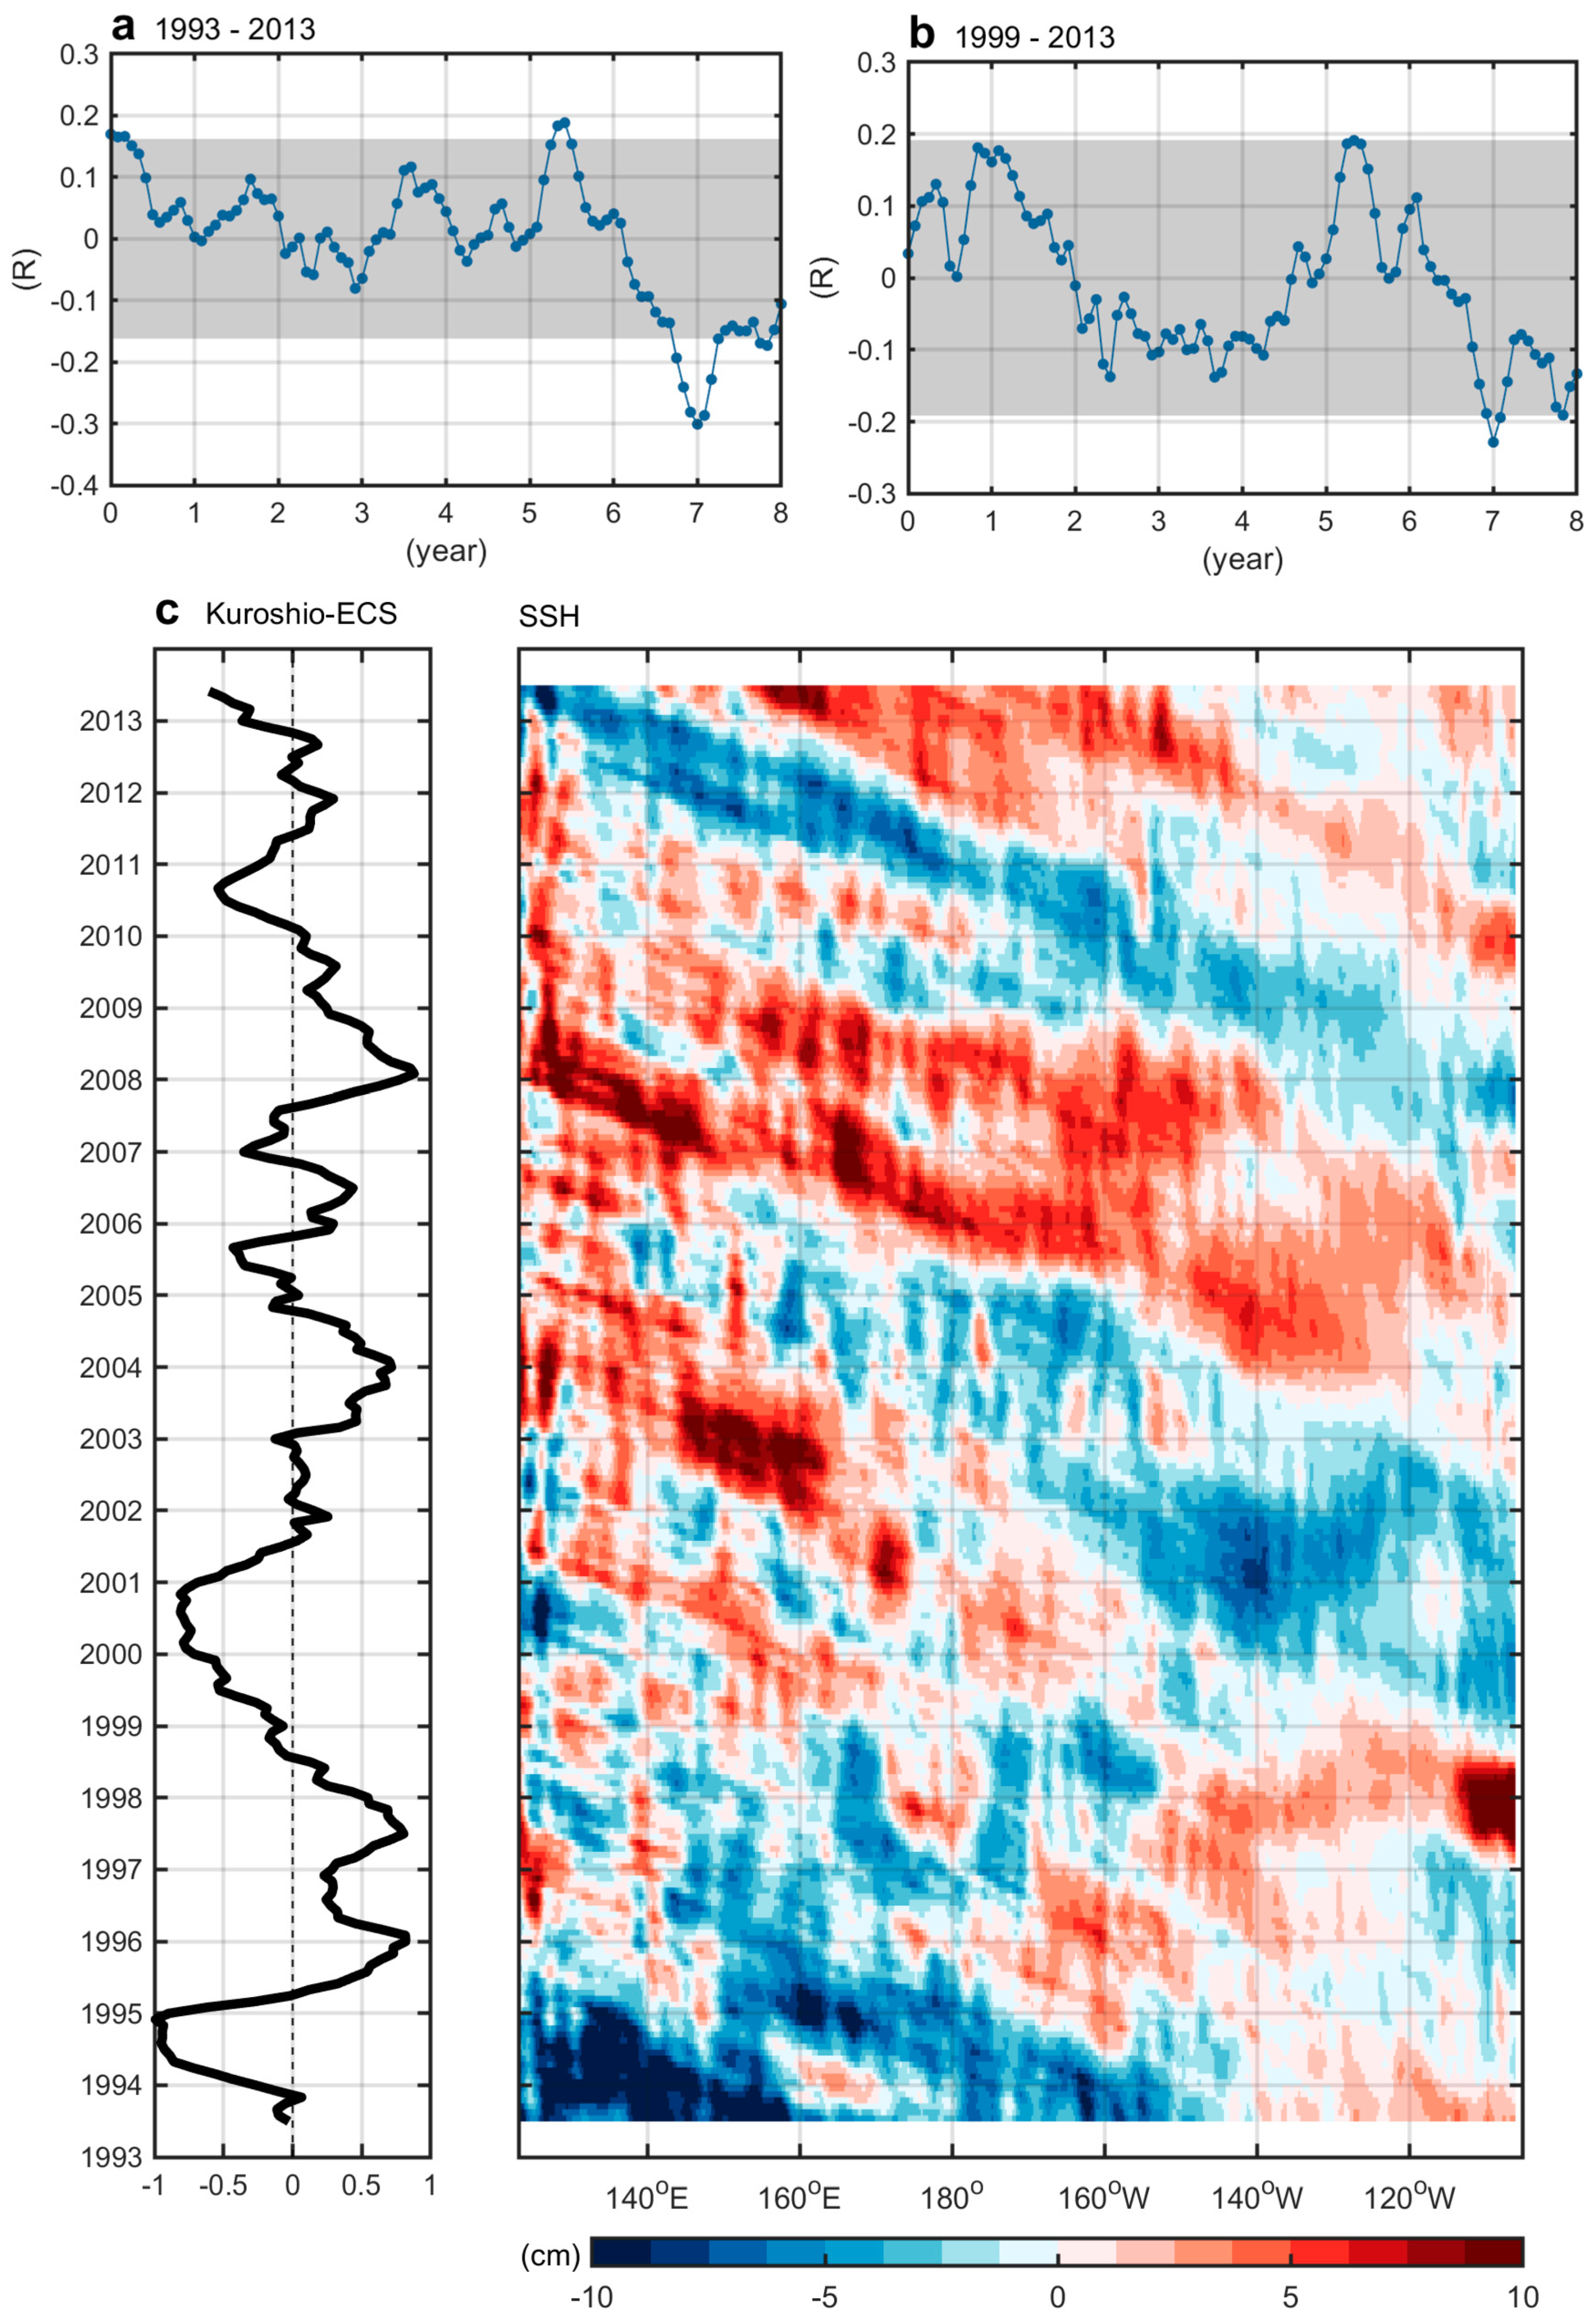
Other than the ocean’s rapid barotropic response to a basin-wide wind field, previous studies observed lagged responses in the western subtropical gyre and Kuroshio Extension relative to atmospheric forcing using historical hydrography and satellite altimetry data [22,45,46,47]. The lagged time ranges between four and seven years in general. To examine temporal lags of baroclinic responses, we applied lagged correlations for the Kuroshio-ECS and PDO during the entire study period of 1993–2013. There are three significant peaks (statistical significance above the 99% confidence level) identified in Figure 7a. The significant peak at zero lag is the barotropic response relative to basin-wide wind field. Another in the lagged correlation occurs at seven-year lag, which reveals the delayed response of the Kuroshio-ECS to PDO-related wind forcing. The positive zero lag and negative seven-year lag peaks are consistent with the findings in Andres et al. [22]. The third significant peak at 5.5-year lag, not due to 3–4 year periodicity in PDO, also likely resulted from the baroclinic response relative to atmospheric variability over the central/eastern North Pacific.
A distinct result is brought to one’s attention while lagged correlations are applied to the period of 1999–2013 when PDO no longer drives the variability of the North Pacific wind field (Figure 7b). As expected, there is no correlation at zero lag. The ocean’s barotropic response to PDO-related wind forcing vanished since the overlying wind field was decoupled from PDO after 1999. Only the delayed baroclinic response with a significant peak at seven-year lag (statistical significance above the 99% confidence level) is manifest, and resulted from westward-propagating baroclinic Rossby waves [22] and/or activities of mesoscale eddy originating in the interior Pacific [30]. Figure 7c further illustrates the baroclinic response of the Kuroshio-ECS to the variability in the eastern North Pacific surface wind field, which shows a Hovmöller diagram of sea surface height anomaly (SSHA) along 23.5°N from AVISO. The latitude of 23.5°N is selected because it is not blocked from the Ryukyu Islands. The westward-propagating eddies have less effect on higher latitudes of the Kuroshio-ECS because of the presence of islands between Okinawa Island and Tokara Strait [30], resulting in a poor correlation between the Kuroshio-ECS and SSHA signals (figure not shown). Figure 7c shows that the anticyclonic (cyclonic) eddies characterized by positive (negative) SSHAs propagate westward and arrive in the west at time intervals of 5–6 years, increasing (decreasing) the intensity of the Kuroshio-ECS. For example, in the eastern Pacific near 120°W, the positive SSHAs in 1998 reached the western boundary in 2004 when the Kuroshio-ECS was enhanced.
4. Summary
Analyzing 21 years of multi-satellite geostrophic velocity data, we found that the traditional PDO reflected interannual variability of the Kuroshio during 1993–1998, but not since 1999. The first SSTA mode in the North Pacific was replaced by the second mode since 1999. This leading mode succession began in 1999 and is linked to anomalous changes in atmospheric circulation and the surface wind field. Since the overlying wind field was altered, the Kuroshio-ECS departed from the traditional PDO index. This study updates earlier discussions and demonstrates that PDO is not always a reliable proxy for atmospheric and oceanic variability in the North Pacific. The year 1999 coincides with the recent pause in the rise of global mean temperatures, or warming hiatus. This hiatus is mainly evident in the central and eastern Pacific since 1999 [25,26,27,28,39,40,47,48]. During the hiatus, many pronounced changes in atmospheric circulation and surface winds were observed globally, and in the Pacific in particular. The North Pacific subtropical gyre was changed accordingly [20,47,49]. Thereafter, PDO no longer drives the interannual variability of the North Pacific wind field and associated ocean currents, as documented in previous studies [12,13,14]. Since the hiatus is attributed to various climate factors including PDO [27], our finding of the disassociation may implicate that the PDO has less effect on the interannual variability of the northwestern Pacific as its decadal-scale phase shifts to a cold regime of the 1999–2013 hiatus.
Supplementary Materials
The following are available online at https://www.mdpi.com/2072-4292/11/3/276/s1, Figure S1: The spectrum of time series of mode 1 of Kuroshio-ECS; Figure S2: Composite of GSV anomaly during positive phase and negative phase of mode1 of Kuroshio-ECS; Figure S3: The difference of sea surface temperature anomaly (1999–2013 minus 1993–1998); Figure S4: The second mode of SSTA during 1999–2013.
Author Contributions
C.-R.W. and Y.-L.W. conceived and designed the study. C.R.W. led the writing. Y.-L.W. and S.-Y.C. contributed to the writing and data interpretation. Contextualization was carried out by S.-Y.C.
Funding
This research received no external funding.
Acknowledgments
The authors thank those who provided data used in this study. The GSV and MADT data were provided by AVISO, from their website at https://www.aviso.altimetry.fr. The NCEPr1 and ERSST data were provided by NOAA/ESRL, from their web site at https://www.esrl.noaa.gov/.
Conflicts of Interest
The authors declare no conflicts of interest.
References
- Tang, T.Y.; Tai, J.H.; Yang, Y.J. The flow pattern north of Taiwan and the migration of the Kuroshio. Cont. Shelf Res. 2000, 20, 349–371. [Google Scholar] [CrossRef]
- Hsin, Y.-C.; Wu, C.-R.; Shaw, P.-T. Spatial and temporal variations of the Kuroshio east of Taiwan, 1982–2005: A numerical study. J. Geophys. Res. Oceans 2008, 113. [Google Scholar] [CrossRef] [Green Version]
- Nitani, H. Beginning of the Kuroshio. In Kuroshio, Its Physical Aspects; University of Tokyo Press: Tokyo, Japan, 1972; pp. 129–163. [Google Scholar]
- Isobe, A. Recent advances in ocean-circulation research on the Yellow Sea and East China Sea shelves. J. Oceanogr. 2008, 64, 569–584. [Google Scholar] [CrossRef]
- Liu, Z.; Gan, J. Variability of the Kuroshio in the East China Sea derived from satellite altimetry data. Deep Sea Res. Part I 2012, 59, 25–36. [Google Scholar] [CrossRef]
- Guo, X.; Miyazawa, Y.; Yamagata, T. The Kuroshio Onshore Intrusion along the Shelf Break of the East China Sea: The Origin of the Tsushima Warm Current. J. Phys. Oceanogr. 2006, 36, 2205–2231. [Google Scholar] [CrossRef]
- Ichikawa, K.; Tokeshi, R.; Kashima, M.; Sato, K.; Matsuoka, T.; Kojima, S.; Fujii, S. Kuroshio variations in the upstream region as seen by HF radar and satellite altimetry data. Int. J. Remote Sens. 2008, 29, 6417–6426. [Google Scholar] [CrossRef]
- Wu, C.-R.; Lu, H.-F.; Chao, S.-Y. A numerical study on the formation of upwelling off northeast Taiwan. J. Geophys. Res. Oceans 2008, 113. [Google Scholar] [CrossRef] [Green Version]
- Hsin, Y.-C.; Chiang, T.-L.; Wu, C.-R. Fluctuations of the thermal fronts off northeastern Taiwan. J. Geophys. Res. 2011, 116. [Google Scholar] [CrossRef] [Green Version]
- Wong, G.T.F.; Hung, C.-C.; Gong, G.-C. Dissolved iodine species in the East China Sea—A complementary tracer for upwelling water on the shelf. Cont. Shelf Res. 2004, 24, 1465–1484. [Google Scholar] [CrossRef]
- Hwang, C.; Kao, R. TOPEX/POSEIDON-derived space–time variations of the Kuroshio Current: Applications of a gravimetric geoid and wavelet analysis. Geophys. J. Int. 2002, 151, 835–847. [Google Scholar] [CrossRef]
- Han, G.; Huang, W. Pacific Decadal Oscillation and Sea Level Variability in the Bohai, Yellow, and East China Seas. J. Phys. Oceanogr. 2008, 38, 2772–2783. [Google Scholar] [CrossRef]
- Andres, M.; Park, J.-H.; Wimbush, M.; Zhu, X.-H.; Nakamura, H.; Kim, K.; Chang, K.-I. Manifestation of the Pacific Decadal Oscillation in the Kuroshio. Geophys. Res. Lett. 2009, 36. [Google Scholar] [CrossRef] [Green Version]
- Gordon, A.L.; Giulivi, C.F. Pacific decadal oscillation and sea level in the Japan/East sea. Deep Sea Res. Part I 2004, 51, 653–663. [Google Scholar] [CrossRef]
- Newman, M.; Alexander, M.A.; Ault, T.R.; Cobb, K.M.; Deser, C.; Di Lorenzo, E.; Mantua, N.J.; Miller, A.J.; Minobe, S.; Nakamura, H. The Pacific decadal oscillation, revisited. J. Clim. 2016, 29, 4399–4427. [Google Scholar] [CrossRef]
- Schneider, N.; Cornuelle, B.D. The Forcing of the Pacific Decadal Oscillation. J. Clim. 2005, 18, 4355–4373. [Google Scholar] [CrossRef]
- Mantua, N.J.; Hare, S.R. The Pacific Decadal Oscillation. J. Oceanogr. 2002, 58, 35–44. [Google Scholar] [CrossRef]
- Seager, R.; Kushnir, Y.; Naik, N.H.; Cane, M.A.; Miller, J. Wind-Driven Shifts in the Latitude of the Kuroshio–Oyashio Extension and Generation of SST Anomalies on Decadal Timescales. J. Clim. 2001, 14, 4249–4265. [Google Scholar] [CrossRef]
- Mantua, N.J.; Hare, S.R.; Zhang, Y.; Wallace, J.M.; Francis, R.C. A Pacific interdecadal climate oscillation with impacts on salmon production. Bull. Am. Meteorol. Soc. 1997, 78, 1069–1079. [Google Scholar] [CrossRef]
- Wang, Y.-L.; Wu, C.-R.; Chao, S.-Y. Warming and weakening trends of the Kuroshio during 1993–2013. Geophys. Res. Lett. 2016, 43, 9200–9207. [Google Scholar] [CrossRef]
- Hu, D.; Wu, L.; Cai, W.; Gupta, A.S.; Ganachaud, A.; Qiu, B.; Gordon, A.L.; Lin, X.; Chen, Z.; Hu, S.; et al. Pacific western boundary currents and their roles in climate. Nature 2015, 522, 299–308. [Google Scholar] [CrossRef]
- Andres, M.; Kwon, Y.-O.; Yang, J. Observations of the Kuroshio’s barotropic and baroclinic responses to basin-wide wind forcing. J. Geophys. Res. 2011, 116. [Google Scholar] [CrossRef]
- Deser, C.; Alexander, M.A.; Xie, S.-P.; Phillips, A.S. Sea surface temperature variability: Patterns and mechanisms. Annu. Rev. Mar. Sci. 2010, 2, 115–143. [Google Scholar] [CrossRef] [PubMed]
- Zhang, R.; Delworth, T.L. Impact of the Atlantic multidecadal oscillation on North Pacific climate variability. Geophys. Res. Lett. 2007, 34. [Google Scholar] [CrossRef]
- Medhaug, I.; Stolpe, M.B.; Fischer, E.M.; Knutti, R. Reconciling controversies about the ‘global warming hiatus’. Nature 2017, 545, 41. [Google Scholar] [CrossRef] [PubMed]
- Hu, S.; Fedorov, A.V. The extreme El Niño of 2015–2016 and the end of global warming hiatus. Geophys. Res. Lett. 2017, 44, 3816–3824. [Google Scholar] [CrossRef]
- Trenberth, K.E.; Fasullo, J.T.; Branstator, G.; Phillips, A.S. Seasonal aspects of the recent pause in surface warming. Nat. Clim. Chang. 2014, 4, 911–916. [Google Scholar] [CrossRef]
- England, M.H.; McGregor, S.; Spence, P.; Meehl, G.A.; Timmermann, A.; Cai, W.; Gupta, A.S.; McPhaden, M.J.; Purich, A.; Santoso, A. Recent intensification of wind-driven circulation in the Pacific and the ongoing warming hiatus. Nat. Clim. Chang. 2014, 4, 222–227. [Google Scholar] [CrossRef] [Green Version]
- Nakamura, H.; Nishina, A.; Tabata, K.; Higashi, M.; Habano, A.; Yamashiro, T. Surface velocity time series derived from satellite altimetry data in a section across the Kuroshio southwest of Kyushu. J. Oceanogr. 2012, 68, 321–336. [Google Scholar] [CrossRef]
- Soeyanto, E.; Guo, X.; Ono, J.; Miyazawa, Y. Interannual variations of Kuroshio transport in the East China Sea and its relation to the Pacific Decadal Oscillation and mesoscale eddies. J. Geophys. Res. Oceans 2014, 119, 3595–3616. [Google Scholar] [CrossRef] [Green Version]
- Ichikawa, K. Variation of the Kuroshio in the Tokara Strait induced by meso-scale eddies. J. Oceanogr. 2001, 57, 55–68. [Google Scholar] [CrossRef]
- Nagano, A.; Ichikawa, K.; Ichikawa, H.; Tomita, H.; Tokinaga, H.; Konda, M. Stable volume and heat transports of the North Pacific subtropical gyre revealed by identifying the Kuroshio in synoptic hydrography south of Japan. J. Geophys. Res. Oceans 2010, 115. [Google Scholar] [CrossRef] [Green Version]
- Rio, M.; Mulet, S.; Picot, N. New global Mean Dynamic Topography from a GOCE geoid model, altimeter measurements and oceanographic in-situ data. In Proceedings of the ESA Living Planet Symposium, Edinburgh, UK, 9–13 September 2013. [Google Scholar]
- Hsin, Y.-C.; Qu, T.; Wu, C.-R. Intra-seasonal variation of the Kuroshio southeast of Taiwan and its possible forcing mechanism. Ocean Dyn. 2010, 60, 1293–1306. [Google Scholar] [CrossRef]
- Manly, B.F. Randomization, Bootstrap and Monte Carlo Methods in Biology; CRC Press: Boca Raton, FL, USA, 2006; Volume 70. [Google Scholar]
- Kawabe, M. Variability of Kuroshio velocity assessed from the sea-level difference between Naze and Nishinoomote. J. Oceanogr. 1988, 44, 293–304. [Google Scholar] [CrossRef]
- Sun, X. Analysis of the surface path of the Kuroshio in the East China Sea. In Essays on the Investigation of Kuroshio; China Ocean Press: Beijing, China, 1987; pp. 1–14. [Google Scholar]
- Di Lorenzo, E.; Schneider, N.; Cobb, K.M.; Franks, P.J.S.; Chhak, K.; Miller, A.J.; McWilliams, J.C.; Bograd, S.J.; Arango, H.; Curchitser, E.; et al. North Pacific Gyre Oscillation links ocean climate and ecosystem change. Geophys. Res. Lett. 2008, 35. [Google Scholar] [CrossRef] [Green Version]
- McGregor, S.; Timmermann, A.; Stuecker, M.F.; England, M.H.; Merrifield, M.; Jin, F.-F.; Chikamoto, Y. Recent Walker circulation strengthening and Pacific cooling amplified by Atlantic warming. Nat. Clim. Chang. 2014, 4, 888–892. [Google Scholar] [CrossRef] [Green Version]
- Easterling, D.R.; Wehner, M.F. Is the climate warming or cooling? Geophys. Res. Lett. 2009, 36. [Google Scholar] [CrossRef] [Green Version]
- Stommel, H. The westward intensification of wind-driven ocean currents. Eos Trans. Am. Geophys. Union 1948, 29, 202–206. [Google Scholar] [CrossRef]
- Walker, G.T.; Bliss, E. World Weather V. Memoirs of the Royal Meteorological Society 1932, 4, 53–84. [Google Scholar]
- Chhak, K.C.; Di Lorenzo, E.; Schneider, N.; Cummins, P.F. Forcing of Low-Frequency Ocean Variability in the Northeast Pacific. J. Clim. 2009, 22, 1255–1276. [Google Scholar] [CrossRef]
- Newman, M.; Compoew, G.P.; Alexander, M.A. ENSO-Forced Variability of the Pacific Decadal Oscillation. J. Clim. 2003, 16, 3853–3857. [Google Scholar] [CrossRef] [Green Version]
- Miller, A.J.; Cayan, D.R.; White, W.B. A westward-intensified decadal change in the North Pacific thermocline and gyre-scale circulation. J. Clim. 1998, 11, 3112–3127. [Google Scholar] [CrossRef]
- Deser, C.; Alexander, M.A.; Timlin, M.S. Evidence for a wind-driven intensification of the Kuroshio Current Extension from the 1970s to the 1980s. J. Clim. 1999, 12, 1697–1706. [Google Scholar] [CrossRef]
- Wang, Y.-L.; Wu, C.-R. Enhanced warming and intensification of the Kuroshio Extension, 1999–2013. Remote Sens. 2019, 11, 101. [Google Scholar] [CrossRef]
- Kosaka, Y.; Xie, S.P. Recent global-warming hiatus tied to equatorial Pacific surface cooling. Nature 2013, 501, 403–407. [Google Scholar] [CrossRef] [PubMed] [Green Version]
- Wang, Y.-L.; Wu, C.-R. Discordant multi-decadal trend in the intensity of the Kuroshio along its path during 1993–2013. Sci. Rep. 2018, 8, 14633. [Google Scholar] [CrossRef] [PubMed]
Figure 1.
(a) Oceanographic setting, 200-m isobath (black contour), and spatial pattern of the first empirical orthogonal function (EOF) mode of Kuroshio Current/East China Sea (Kuroshio-ECS) derived from the monthly geostrophic velocity data (GSV), . (b) Time series of the monthly Pacific Decadal Oscillation (PDO; in green) and mode-1 Kuroshio-ECS (in thick black). The thin black curve is the original time series of the Kuroshio-ECS. Red and blue bars are the positive and negative phase of the original time series of the PDO. (c) Time-dependent correlation (two-year window) between time series of the PDO and the first mode of the Kuroshio-ECS. The heavy (thin) curve indicates statistical significance above (below) the 95% confidence level.

Figure 2.
(a) Correlation between the GSV and the PDO during 1993–1998. (b) Same as (a) but during 1999–2013. Dots indicate statistical significance above the 99% confidence level; the 200-m isobath (contour) is also shown. Data shallower than 100 m were ignored.
Figure 2.
(a) Correlation between the GSV and the PDO during 1993–1998. (b) Same as (a) but during 1999–2013. Dots indicate statistical significance above the 99% confidence level; the 200-m isobath (contour) is also shown. Data shallower than 100 m were ignored.

Figure 3.
Correlations between the Kuroshio-ECS and zonally averaged wind stress curl (WSC) during 1993–1998 (blue line) and 1999–2013 (red line). Solid circles indicate statistical significance above the 99% confidence level. Gray shading indicates the latitudes of the ECS; a 1.5-year low-pass filter was applied before calculating correlation.

Figure 4.
Correlation pattern between Sverdrup transport and the Kuroshio-ECS during (a) 1993–1998 and (b) 1999–2013. The shading interval is 0.1, and the black curve indicates the 0.5 contour; a 1.5-year low-pass filter was applied before calculating correlation.
Figure 4.
Correlation pattern between Sverdrup transport and the Kuroshio-ECS during (a) 1993–1998 and (b) 1999–2013. The shading interval is 0.1, and the black curve indicates the 0.5 contour; a 1.5-year low-pass filter was applied before calculating correlation.

Figure 5.
(a) Spatial pattern of the first EOF mode of the North Pacific sea surface temperature anomalies (SSTA) and associated winds computed over 1900–2013. (b) Same as (a), but for the second EOF mode.
Figure 5.
(a) Spatial pattern of the first EOF mode of the North Pacific sea surface temperature anomalies (SSTA) and associated winds computed over 1900–2013. (b) Same as (a), but for the second EOF mode.

Figure 6.
(a) Same as Figure 5a, but computed over 1999–2013. (b) Zonally (120°E–100°W) averaged WSC anomaly computed over the positive phase of the 1999–2013 first mode. Shading indicates the Kuroshio-ECS region. (c) Time series of the 1999–2013 first SSTA mode (black) and the PDO index (green), superimposed with time series of the 1900–2013 second SSTA mode (red).

Figure 7.
Baroclinic responses of the Kuroshio-ECS to the PDO. (a) Lag correlation between the PDO and Kuroshio-ECS during 1993–2013. Shading is the 99% confidence interval. (b) Same as (a), but during 1999–2013. (c) The Kuroshio-ECS index and Hovmöller diagram of sea surface height anomaly along 23.5°N based on AVISO (Archiving, Validation, and Interpretation of Satellite Oceanographic data). A 13-month running average was applied to the data.

© 2019 by the authors. Licensee MDPI, Basel, Switzerland. This article is an open access article distributed under the terms and conditions of the Creative Commons Attribution (CC BY) license (http://creativecommons.org/licenses/by/4.0/).
Share and Cite
MDPI and ACS Style
Wu, C.-R.; Wang, Y.-L.; Chao, S.-Y. Disassociation of the Kuroshio Current with the Pacific Decadal Oscillation Since 1999. Remote Sens. 2019, 11, 276. https://doi.org/10.3390/rs11030276
AMA Style
Wu C-R, Wang Y-L, Chao S-Y. Disassociation of the Kuroshio Current with the Pacific Decadal Oscillation Since 1999. Remote Sensing. 2019; 11(3):276. https://doi.org/10.3390/rs11030276
Chicago/Turabian StyleWu, Chau-Ron, You-Lin Wang, and Shenn-Yu Chao. 2019. "Disassociation of the Kuroshio Current with the Pacific Decadal Oscillation Since 1999" Remote Sensing 11, no. 3: 276. https://doi.org/10.3390/rs11030276
Note that from the first issue of 2016, this journal uses article numbers instead of page numbers. See further details here.