Combined Impact of El Niño–Southern Oscillation and Pacific Decadal Oscillation on the Northern Winter Stratosphere


1
Key Laboratory of Meteorological Disaster, Ministry of Education (KLME)/Joint International Research Laboratory of Climate and Environment Change (ILCEC)/Collaborative Innovation Center on Forecast and Evaluation of Meteorological Disasters (CIC-FEMD), Nanjing University of Information Science & Technology, Nanjing 210044, China
2
State Key Laboratory of Numerical Modeling for Atmospheric Sciences and Geophysical Fluid Dynamics, Institute of Atmospheric Physics, Chinese Academy of Sciences, Beijing 100029, China
3
Fredy & Nadine Herrmann Institute of Earth Sciences, Hebrew University of Jerusalem, Edmond J. Safra Campus, Givat Ram Jerusalem 91904, Israel
*
Author to whom correspondence should be addressed.
Atmosphere 2019, 10(4), 211; https://doi.org/10.3390/atmos10040211
Submission received: 8 March 2019
/
Revised: 17 April 2019
/
Accepted: 18 April 2019
/
Published: 22 April 2019
(This article belongs to the Section Meteorology)
Abstract
:Using reanalysis and the sea surface temperature (SST) analysis, the combined impact of El Niño-Southern Oscillation (ENSO) and Pacific Decadal Oscillation (PDO) on the northern winter stratosphere is investigated. The warm and weak stratospheric polar vortex response to El Niño simply appears during positive PDO, whereas the cold and strong stratospheric polar vortex response to La Niña is preferable during negative PDO in the reanalysis. Two mechanisms may account for the enhanced stratospheric response when ENSO and PDO are in phase. First, the asymmetries of the intensity and frequency between El Niño and La Niña can be identified for the two PDO phases. Second, the extratropical SST anomalies in the North Pacific may also play a role in the varying extratropical response to ENSO. The North Pacific SST anomalies related to PDO superimpose ENSO SST anomalies when they are in phase but undermine them when they are out of phase. The superimposed North Pacific SST anomalies help to increase SST meridional gradient anomalies between tropical and extratropics, as well as to lock the local height response to ENSO. Therefore, the passages for the upward propagation of waves from the troposphere is more unimpeded when positive PDO is configured with El Niño, and vice versa when negative PDO is configured with La Niña.
1. Introduction
The significant response of the northern winter stratosphere to El Niño–Southern Oscillation (ENSO) has been widely reported in a large number of observational [1,2,3,4,5] and modeling [6,7,8,9,10,11,12,13,14] studies. However, recent studies showed that the enhanced planetary wave response to El Niño and the suppressed planetary wave response to La Niña is asymmetric [15,16,17]. Specifically, due to the nonlinear relationship between sea surface temperature (SST) and precipitation, the positive Pacific–North America (PNA)-like height pattern induced by El Niño is usually stronger than the negative PNA pattern induced by La Niña. The positive PNA teleconnection corresponds to a low anomaly center over the North Pacific region (i.e., the Aleutian low), which is in phase with the climatological stationary trough and favors enhancement of the amplitude of climatological waves that can propagate upward into the stratosphere [2,3,18,19].
The intensity and spatial pattern of the PNA teleconnection have been reported to be modulated by the diabatic heating forcing over different tropical ocean basins [14,18,20,21]. The sign of the PNA response is sensitive to the zonal position of the diabatic heating profile. In fact, the precipitation response to tropical SST anomalies in the Pacific is not only determined by the SST anomaly intensity, but also depends on the background SST mean state [15,16,17]. For example, in warm ocean regions, a small SST anomaly can induce strong adiabatic heating, whereas in cold ocean regions, a large SST anomaly can only limitedly disturb the adiabatic heating.
Evidence has indicated that the structure and intensity of the ENSO teleconnection also exhibit profound decadal variations. Since the late 1970s, the PNA teleconnection has shifted eastward, which is intimately associated with the decadal change of the convective center over the equatorial Pacific during El Niño winter [22,23]. The tropospheric ENSO teleconnection pattern shift may be related to the natural variabilities of ENSO [24,25] and the global warming [26,27]. As reported in Zhou et al. [23], different future scenarios in CMIP5 (Phase 5 of the Coupled Model Intercomparison Project [28]) models project an eastward shift of the positive rainfall anomaly center over the equatorial Pacific, which further induces a pattern shift for the forced PNA. It is also documented that with the ENSO intensity increasing, the height anomaly centers of the PNA moves eastward. The configuration between the climatological stationary waves and the projected wave anomalies changes as the PNA shifts [16,29].
In the Pacific sector, a decadal mode known as the Pacific Decadal Oscillation (PDO) can changes the SST mean state and even the ENSO regimes. It was also reported that the PDO can be forced by the tropical Pacific SST [30,31,32,33]. As the first empirical orthogonal function of SST variability in the northern extratropical Pacific [34,35], the PDO is related to change in the occurrence ratio of El Niño and La Niña events. In the positive PDO phase, El Niño occurs more frequently, while La Niña appears less frequently; and vice versa [36]. The modulation of ENSO’s impact on regional climate by PDO is also confirmed in recent studies. For example, the impact of ENSO on Alaskan wintertime temperature, Rocky Mountain fire, European, Mexican, and the Pacific–American climate, the northern Andean glaciers, and the East Asian winter monsoon may depend on the PDO state [37,38,39,40,41,42,43]. It was demonstrated that the European wintertime rainfall response to ENSO is stronger and more significant during the positive PDO than during the negative PDO [44]. Another example is the modulation of the ENSO–China precipitation relationship by PDO [45,46]. The positive correlations between ENSO and South China spring rainfall are largely enhanced when El Niño coincides with the positive PDO and La Niña coincides with the negative PDO [46].
Considering that the forced PNA teleconnection in the troposphere can bridge the ENSO SST and the stratospheric response in the extratropics, the decadal changes in its structure and intensity may have led to the unstable relationship between the stratospheric response and ENSO [47,48]. In this study, we will provide evidence that the unstable stratospheric response to ENSO is mainly controlled by the PDO. We will prove that the stratospheric response to ENSO is more significant when ENSO and PDO are in phase.
This paper consists of five sections. Following the introduction in Section 1, Section 2 describes the data and methodology. Section 3 briefly presents the ENSO SST patterns during different PDO phases. The observed tropospheric responses to El Niño and La Niña under different PDO phases are discussed in Section 4, and the stratospheric responses to different ENSO/PDO configurations are also provided. Finally, the summary and discussion are presented in Section 5.
2. Data and Methodology
2.1. Atmospheric Reanalysis and SST
The National Centers for Environmental Prediction and National Center for Atmospheric Research (NCEP/NCAR) reanalysis I, covering the period 1948–2017 [49], is employed as the atmospheric observations. As reported in Rao et al. [50], the NCEP/NCAR reanalysis has the longest timespan among several reanalyses that have reliable stratospheric climatology and interannual variations. More detailed descriptions about this reanalysis can be found in Kalnay et al. [49]. The SST used to obtain the spatial pattern and time series of PDO and El Niño is extracted from the Hadley Centre sea-ice and sea surface temperature dataset (HadISST) [51].
2.2. Data Processing and Methods
For any variable from the atmospheric reanalysis and SST analysis, its anomaly is obtained by subtracting its long-term trend and seasonal cycle from its monthly mean raw fields during 1948–2017. The observed El Niño signal in the stratosphere may be mixed with the equatorial stratospheric quasi-biennial oscillation (QBO) [13,14,52,53,54,55]. As in previous studies [13,14,15,19], we regressed the wintertime stratospheric circulation and temperature anomalies against the 50 hPa QBO time series. The QBO is defined as the equatorial (5° S–5° N) zonal-mean zonal wind anomalies. Then, the QBO-related circulation and temperature anomalies (products of the regression patterns and the QBO values) are subtracted from the raw anomaly fields above 100 hPa. Then, the QBO-like signals can be filtered out from the stratosphere before the composite is performed, preventing the possible mixture of QBO and ENSO signals.
After subtracting the long-term trend and seasonal cycle of the SST raw field, the Niño3 index was computed as the area-averaged SST anomalies in the Niño3 region (5° S–5° N, 150–90° W). The El Niño events are selected once the winter (December–January–February, DJF) mean Niño3 index exceeds its half standard deviation in the observations (~0.5 K). The PDO mode [30,31,34,56] is the first empirical orthogonal function (EOF) of SST anomalies in the extratropical Pacific sector (poleward of 20° N), and the corresponding normalized time series is defined as the PDO index. We regressed the SST anomalies against the PDO index time series to represent the PDO SST spatial pattern. The positive (high) and negative (low) PDO phases refer to its index sign.
3. ENSO SST Patterns during Positive and Negative PDO Phases
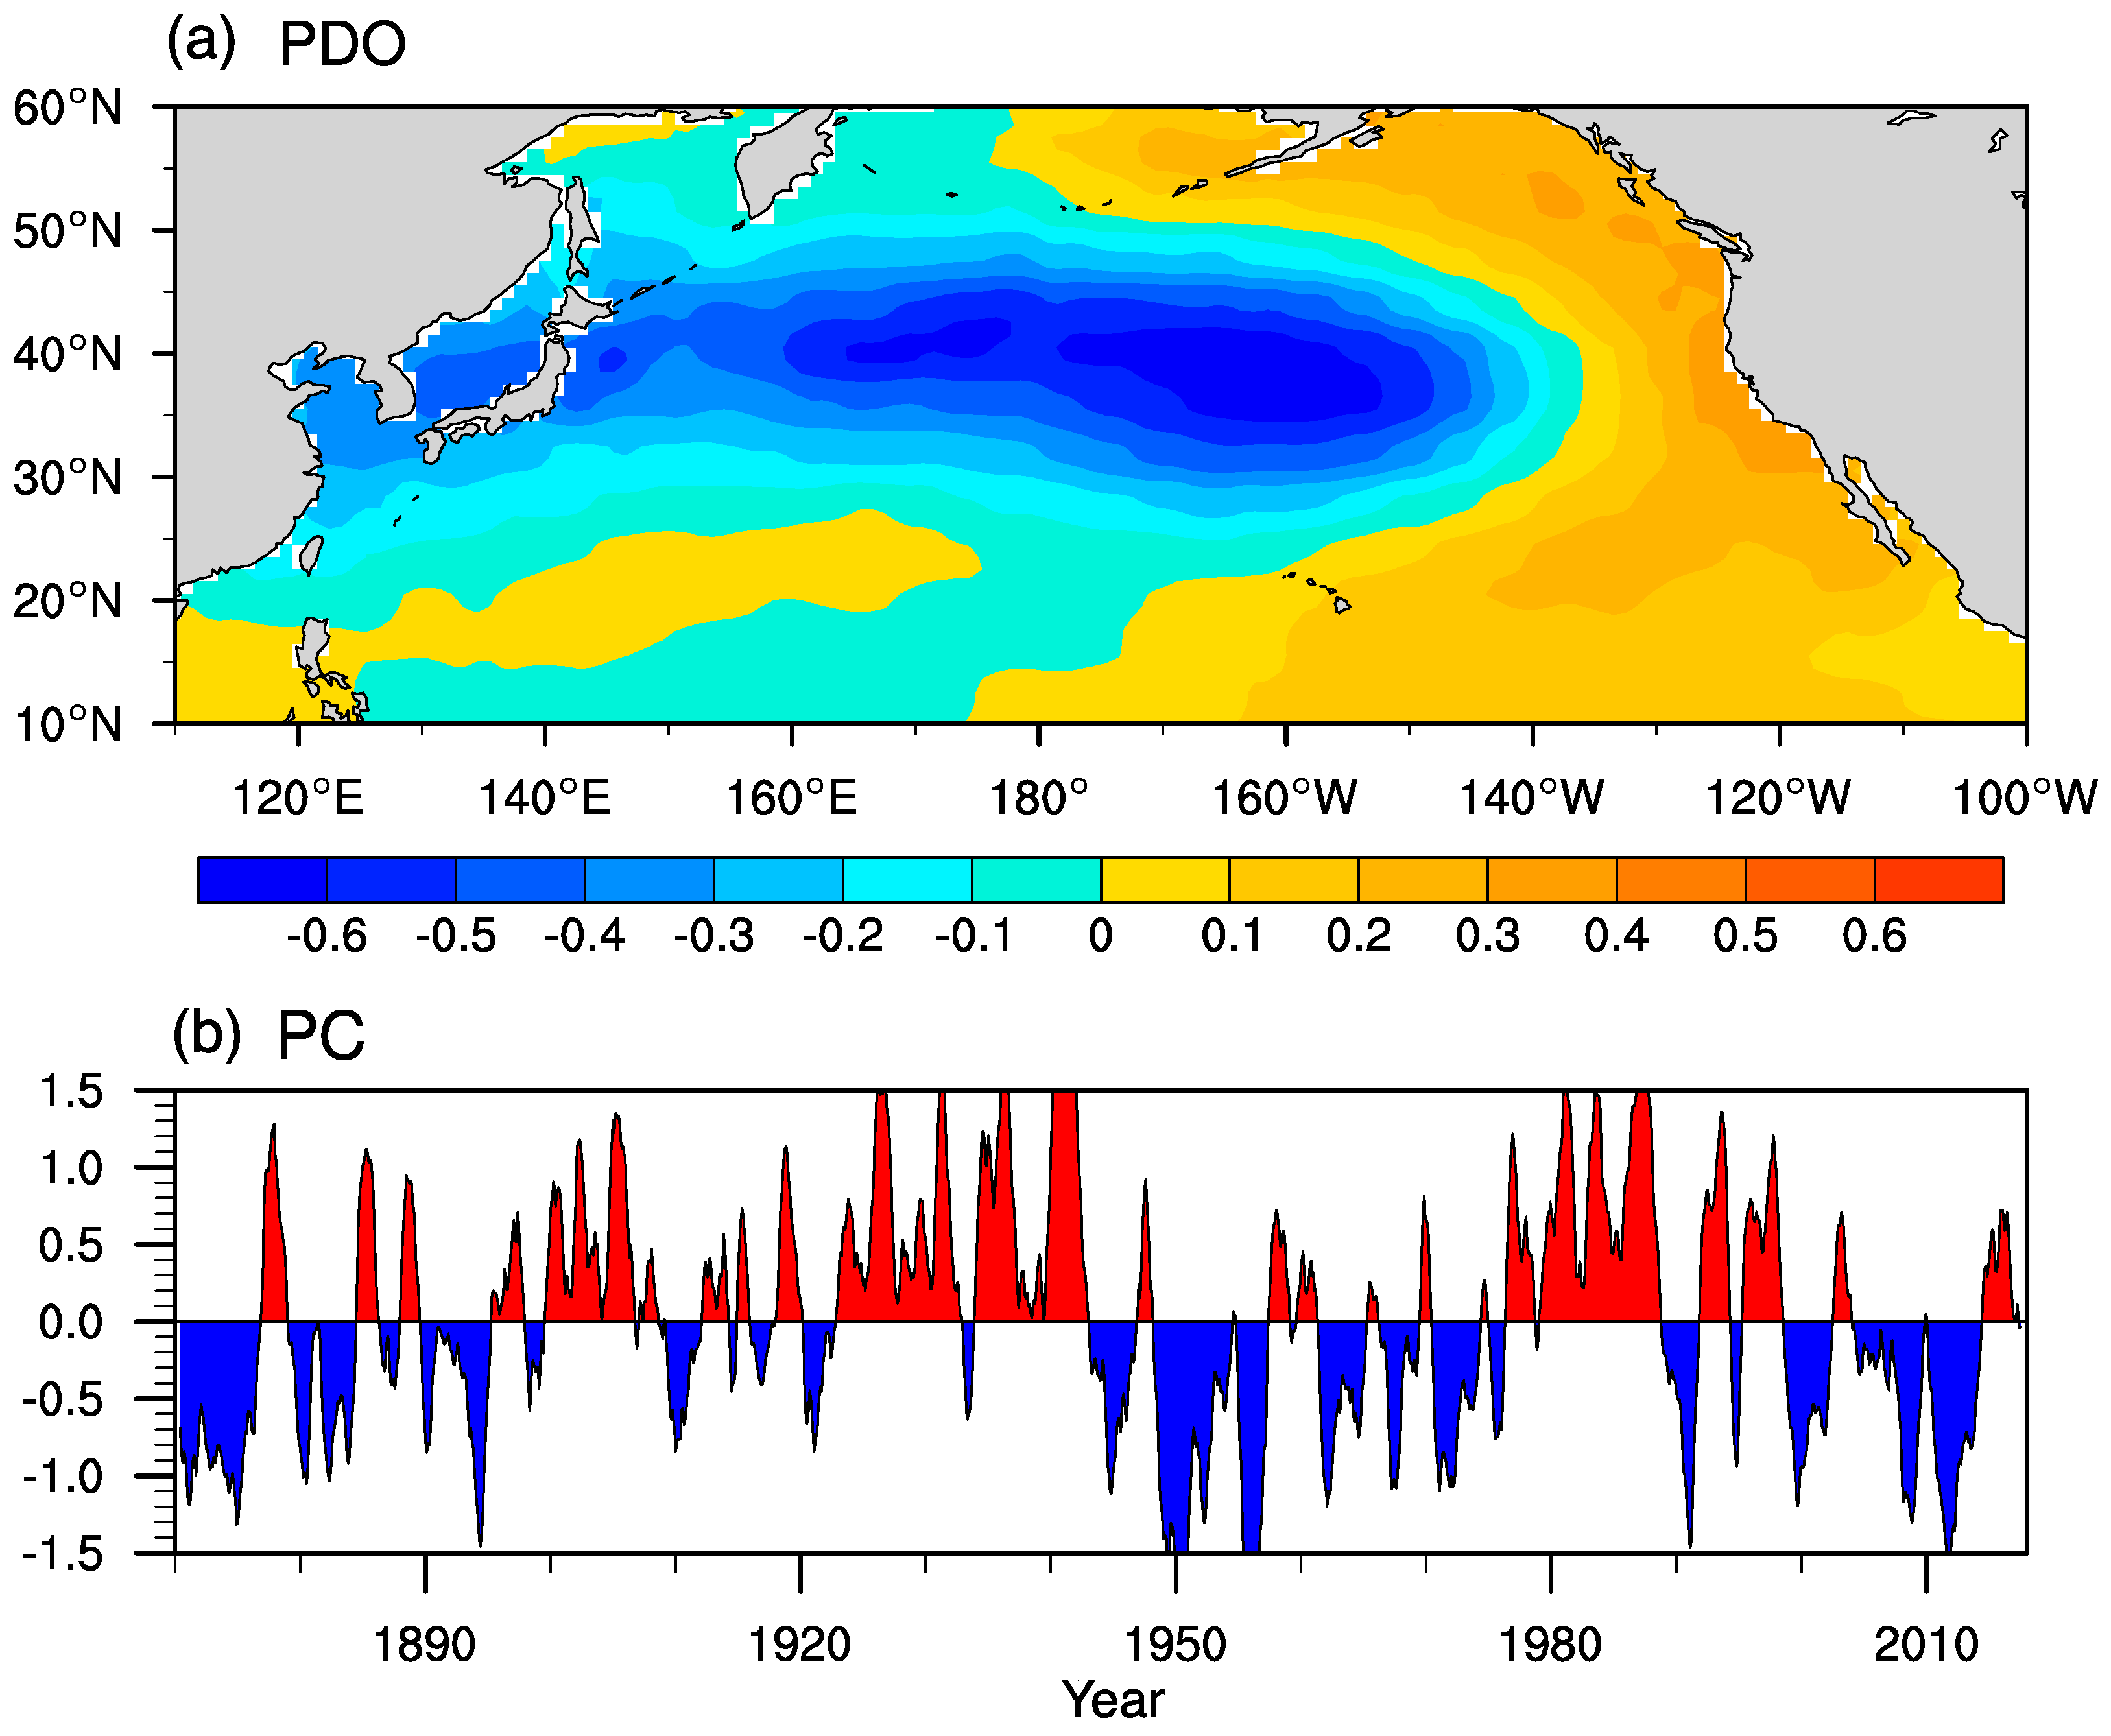
Figure 1 shows the regressed PDO SST pattern and the normalized PDO time series from HadISST. It can be seen that the Northern Hemisphere midlatitude Pacific is covered with anomalous cold water and the western coast of North America and the tropical–subtropical Pacific regions are dominated by warm water during the positive PDO (Figure 1a). The tropical East Pacific cold tongue region is warmer during the positive PDO phase than during the negative PDO phase. The phase conversion of PDO usually leads to decadal change of the stratosphere. For example, Hu et al. [35] reported in their modeling study that the decreasing trend of the PDO (warming of the North Pacific) is responsible for the strengthening of the northern winter stratospheric polar vortex in the past two decades. In observations, short warm PDO phases interrupted the long cold PDO phases from 1940s to 1970s, and short cold PDO phases also broke in the long warm PDO phases from late-1970s to mid-1990s (Figure 1b).
Table 1 lists the different configurations between the 19 (29) observed El Niño (La Niña) events and the PDO phases. To easily distinguish the four configurations between ENSO and PDO, we mark the El Niño/positive PDO configuration with El/P. Similarly, the El/N, La/P, and La/N refer to the El Niño/negative PDO, La Niña/positive PDO, and La Niña/negative PDO configurations, respectively. It can be found that during the positive PDO phase, the number of El Niño and La Niña events are largely asymmetric; namely, El Niño events are twice as likely to happen as La Niña events, consistent with the finding in Verdon and Franks [36] that positive PDO favors the occurrence of El Niño events. In contrast, La Niña events are more likely to occur than El Niño during the negative PDO phase. On average, the El Niño intensity is observed to enhance in the positive PDO (El/P: 1.3 K; El/N: 0.76 K). On contrary, the averaged La Niña intensity is observed to increase in the negative PDO phase (La/P: −0.7 K; La/N: −0.9 K).
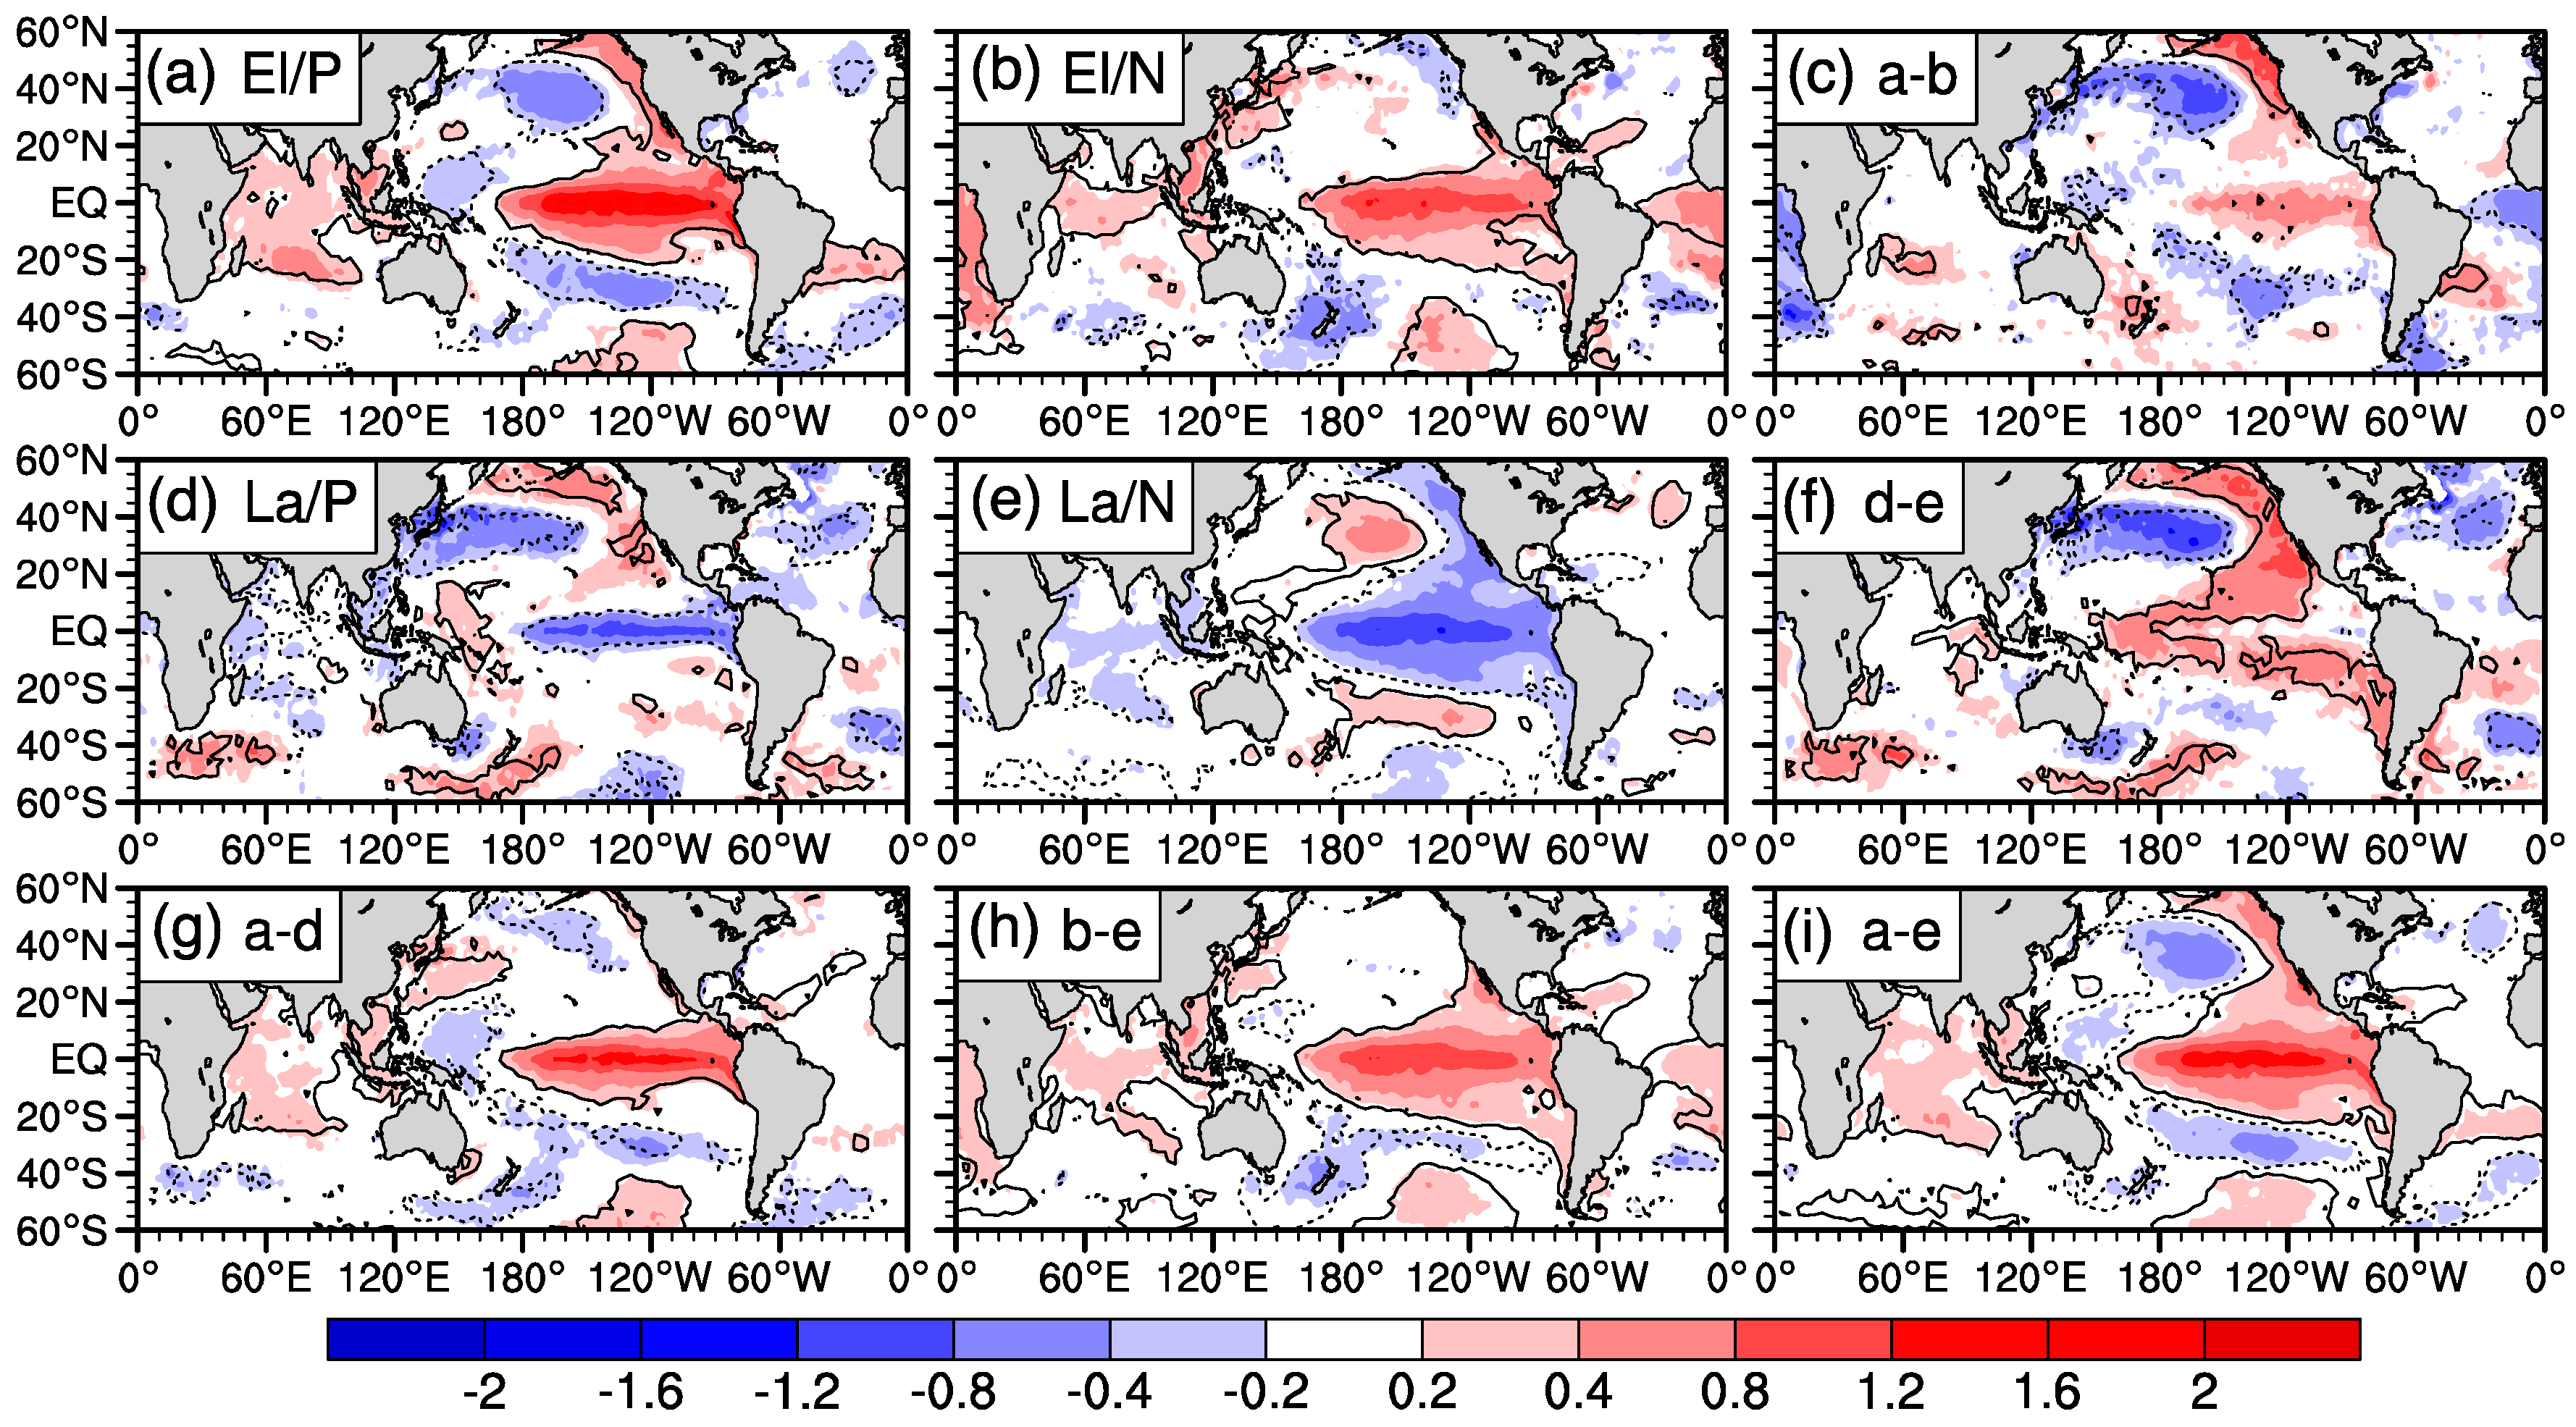
The composite SST anomaly distributions for different configurations between ENSO and PDO and their differences are shown in Figure 2 for HadISST. The distribution of the Pacific ENSO SST anomalies is modulated by the PDO. Positive PDO (Figure 2a) enhances warm SST anomalies in the middle and eastern Pacific during El Niño winters (Figure 2c) with respect to negative PDO (Figure 2b). The observed amplification of warm SST anomalies in the equatorial eastern Pacific is accompanied by the strengthening of cold SST anomalies in the North Pacific. The North Pacific cold SST anomalies do not form in the El/N winters, which are cancelled out by the local warm SST anomalies related to the negative PDO.
Similarly, the La Niña cold SST anomalies in the equatorial middle and eastern Pacific are amplified during the negative PDO phase (Figure 2e), while the cold SST anomaly band becomes narrow in the equatorial middle and eastern Pacific during the positive PDO phase (Figure 2d). Comparing the El Niño and La Niña SST patterns, cold SST anomalies dominated in the North Pacific during the positive PDO phase, although the tropical SST anomalies in El Niño and La Niña winters are oppositely signed during the positive PDO (Figure 2a,d). It is also noticed that the SST anomaly patterns in the El/P and La/N winters are nearly identical but the sign is reversed (Figure 2a,e). It is expected the ENSO SST anomalies were filtered out in Figure 2c,f, because the SST difference between El/P and El/N, as well as the difference between La/P and La/N, shows a PDO SST pattern (Figure 2c,f; also see Figure 1a). The difference between El/P and La/P or the difference between El/N and La/N filters out the PDO SST anomalies (Figure 2g,h). The “pure” ENSO patterns are very similar, but the central SST intensity in the equatorial eastern Pacific during the positive PDO is stronger than during the negative PDO. The similar SST pattern in El/P and La/N winters can also be verified by their half difference (Figure 2i).
4. Modulation of the ENSO Teleconnection by PDO
4.1. Sensitivity of Tropospheric ENSO Teleconnections to PDO Phases
Figure 3 presents the composite precipitation and 200-hPa geopotential height responses to different configurations of ENSO and PDO. Warm SST anomalies in the equatorial middle and eastern Pacific increase the atmospheric instability and enhance the convection, leading to more rainfall (Figure 3a,b). It can be seen that the El Niño-induced rainfall anomalies in the equatorial middle Pacific are larger during the positive PDO than during the negative PDO, which can be explained by the larger warm SST anomalies in El/P winters than in El/N winters (c.f., Figure 2a,b). The general PNA response is also stronger in El/P winters than in El/N winters. For example, the PNA lobes, including the anomalous tropical Pacific high and North Pacific low are also stronger in El/P winters. It can also be found that the anomalous North Pacific low that responds to El Niño is largely weakened during the negative PDO. The cold SST anomalies that usually accompany El Niño can be neutralized by the negative PDO, which results in a weaker SST meridional gradient anomaly in the North Pacific and less significant height response at 200 hPa. Hu et al. [57] also found that the global warming SST forcing decreasing from the Equator to the Poles induces a stronger extratropical wave and stratospheric temperature responses than the uniform warm SST anomaly forcing does.
In contrast, the cold SST anomalies in the North Pacific related to the positive PDO overwhelm the La Niña SST anomalies, and the cold SST anomaly band in the tropical Pacific is also fairly narrow (Figure 2d), so the negative PNA response is not formed (Figure 3c). Instead, an anomalous low appears over the North Pacific, although negative (albeit weak) height response also appears over the tropical Pacific. The La Niña teleconnection during the negative PDO (Figure 3d) is largely similar to the El Niño teleconnection during the positive PDO (Figure 3a) but with the sign reversed. An anomalous high appears over the North Pacific, and two anomalous lows appear over the tropical middle Pacific and Arctic Canada, respectively. Therefore, the local SST associated with the PDO state should be considered for the extratropical Pacific response to ENSO.
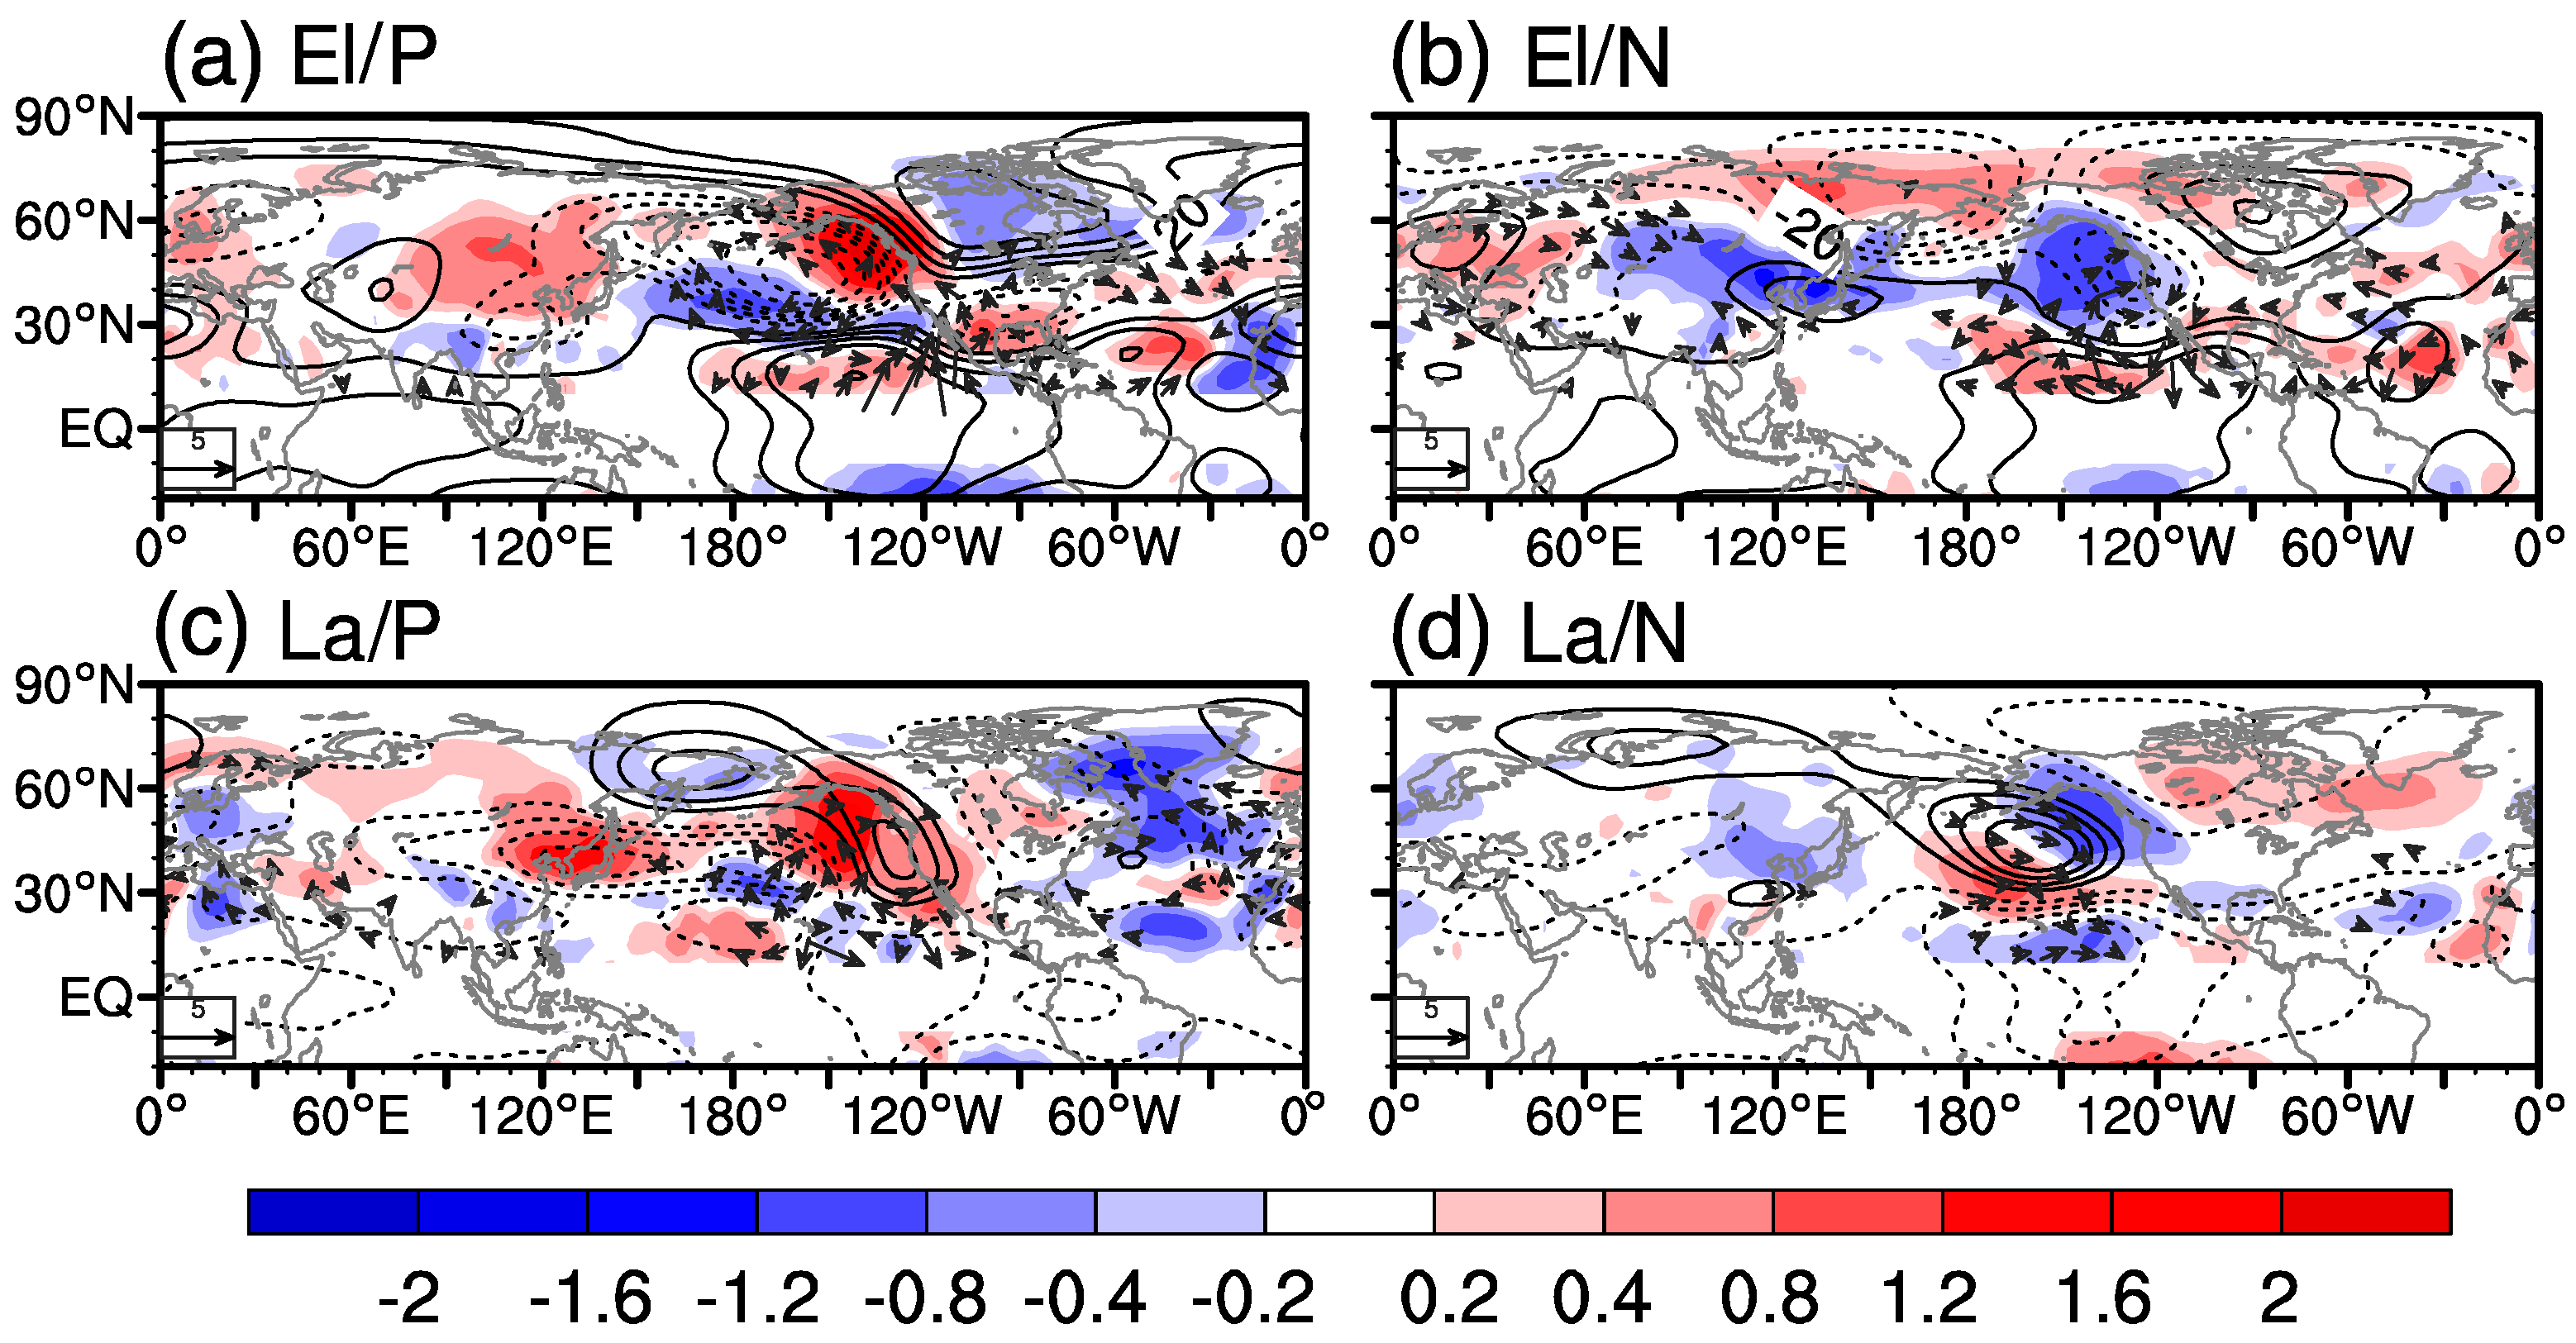
To well understand the height responses in Figure 3, the 200-hPa wave activity flux [58] anomalies during the four different ENSO/PDO configurations are shown in Figure 4. As the convection over the tropical Central and East Pacific is enhanced, a wave-like response forms over the extratropical Pacific. The wave train emanates from the tropical Central Pacific, propagates along an arc, and bridges tropical thermal forcing with local circulation variations in the extratropical Pacific and North America (Figure 4a,b). The Pacific ENSO acts as a wave source through changing the tropical convections and excites a PNA-like response. The amplitude and direction of the horizontal wave flux components are nearly identical over the North Pacific between El/P and El/N configurations. The vertical wave flux components, however, is contrastingly different in El Niño winters between the two phases of PDO, implying different vertical passages for upward wave propagation. The dominant vertical passage is situated over East Asia and the western coast of North America for the anomalous upward propagating waves during the positive PDO, while this passage is biased poleward to the Arctic Ocean during the negative PDO. In contrast, the response of the wave activity flux at 200 hPa in La/P winters is mainly controlled by the cold SST anomalies in North Pacific associated with the positive PDO (Figure 4c), which largely resembles the response in the El/P winters. Specifically, the enhanced waves in the troposphere propagate upward from the East Asia and the western coast of Canada but propagate downward over the North Atlantic. The wave activity response to SST anomalies during the La/N winters is generally symmetric with that during the El/P winters (Figure 4a,d). The positive height anomalies over the North Pacific during the La/N winters weaken the climatological stationary trough there (Figure 4d). Furthermore, negative vertical wave activity flux appears in the East Asia and the western coast of Canada, where planetary waves are suppressed to propagate upward.
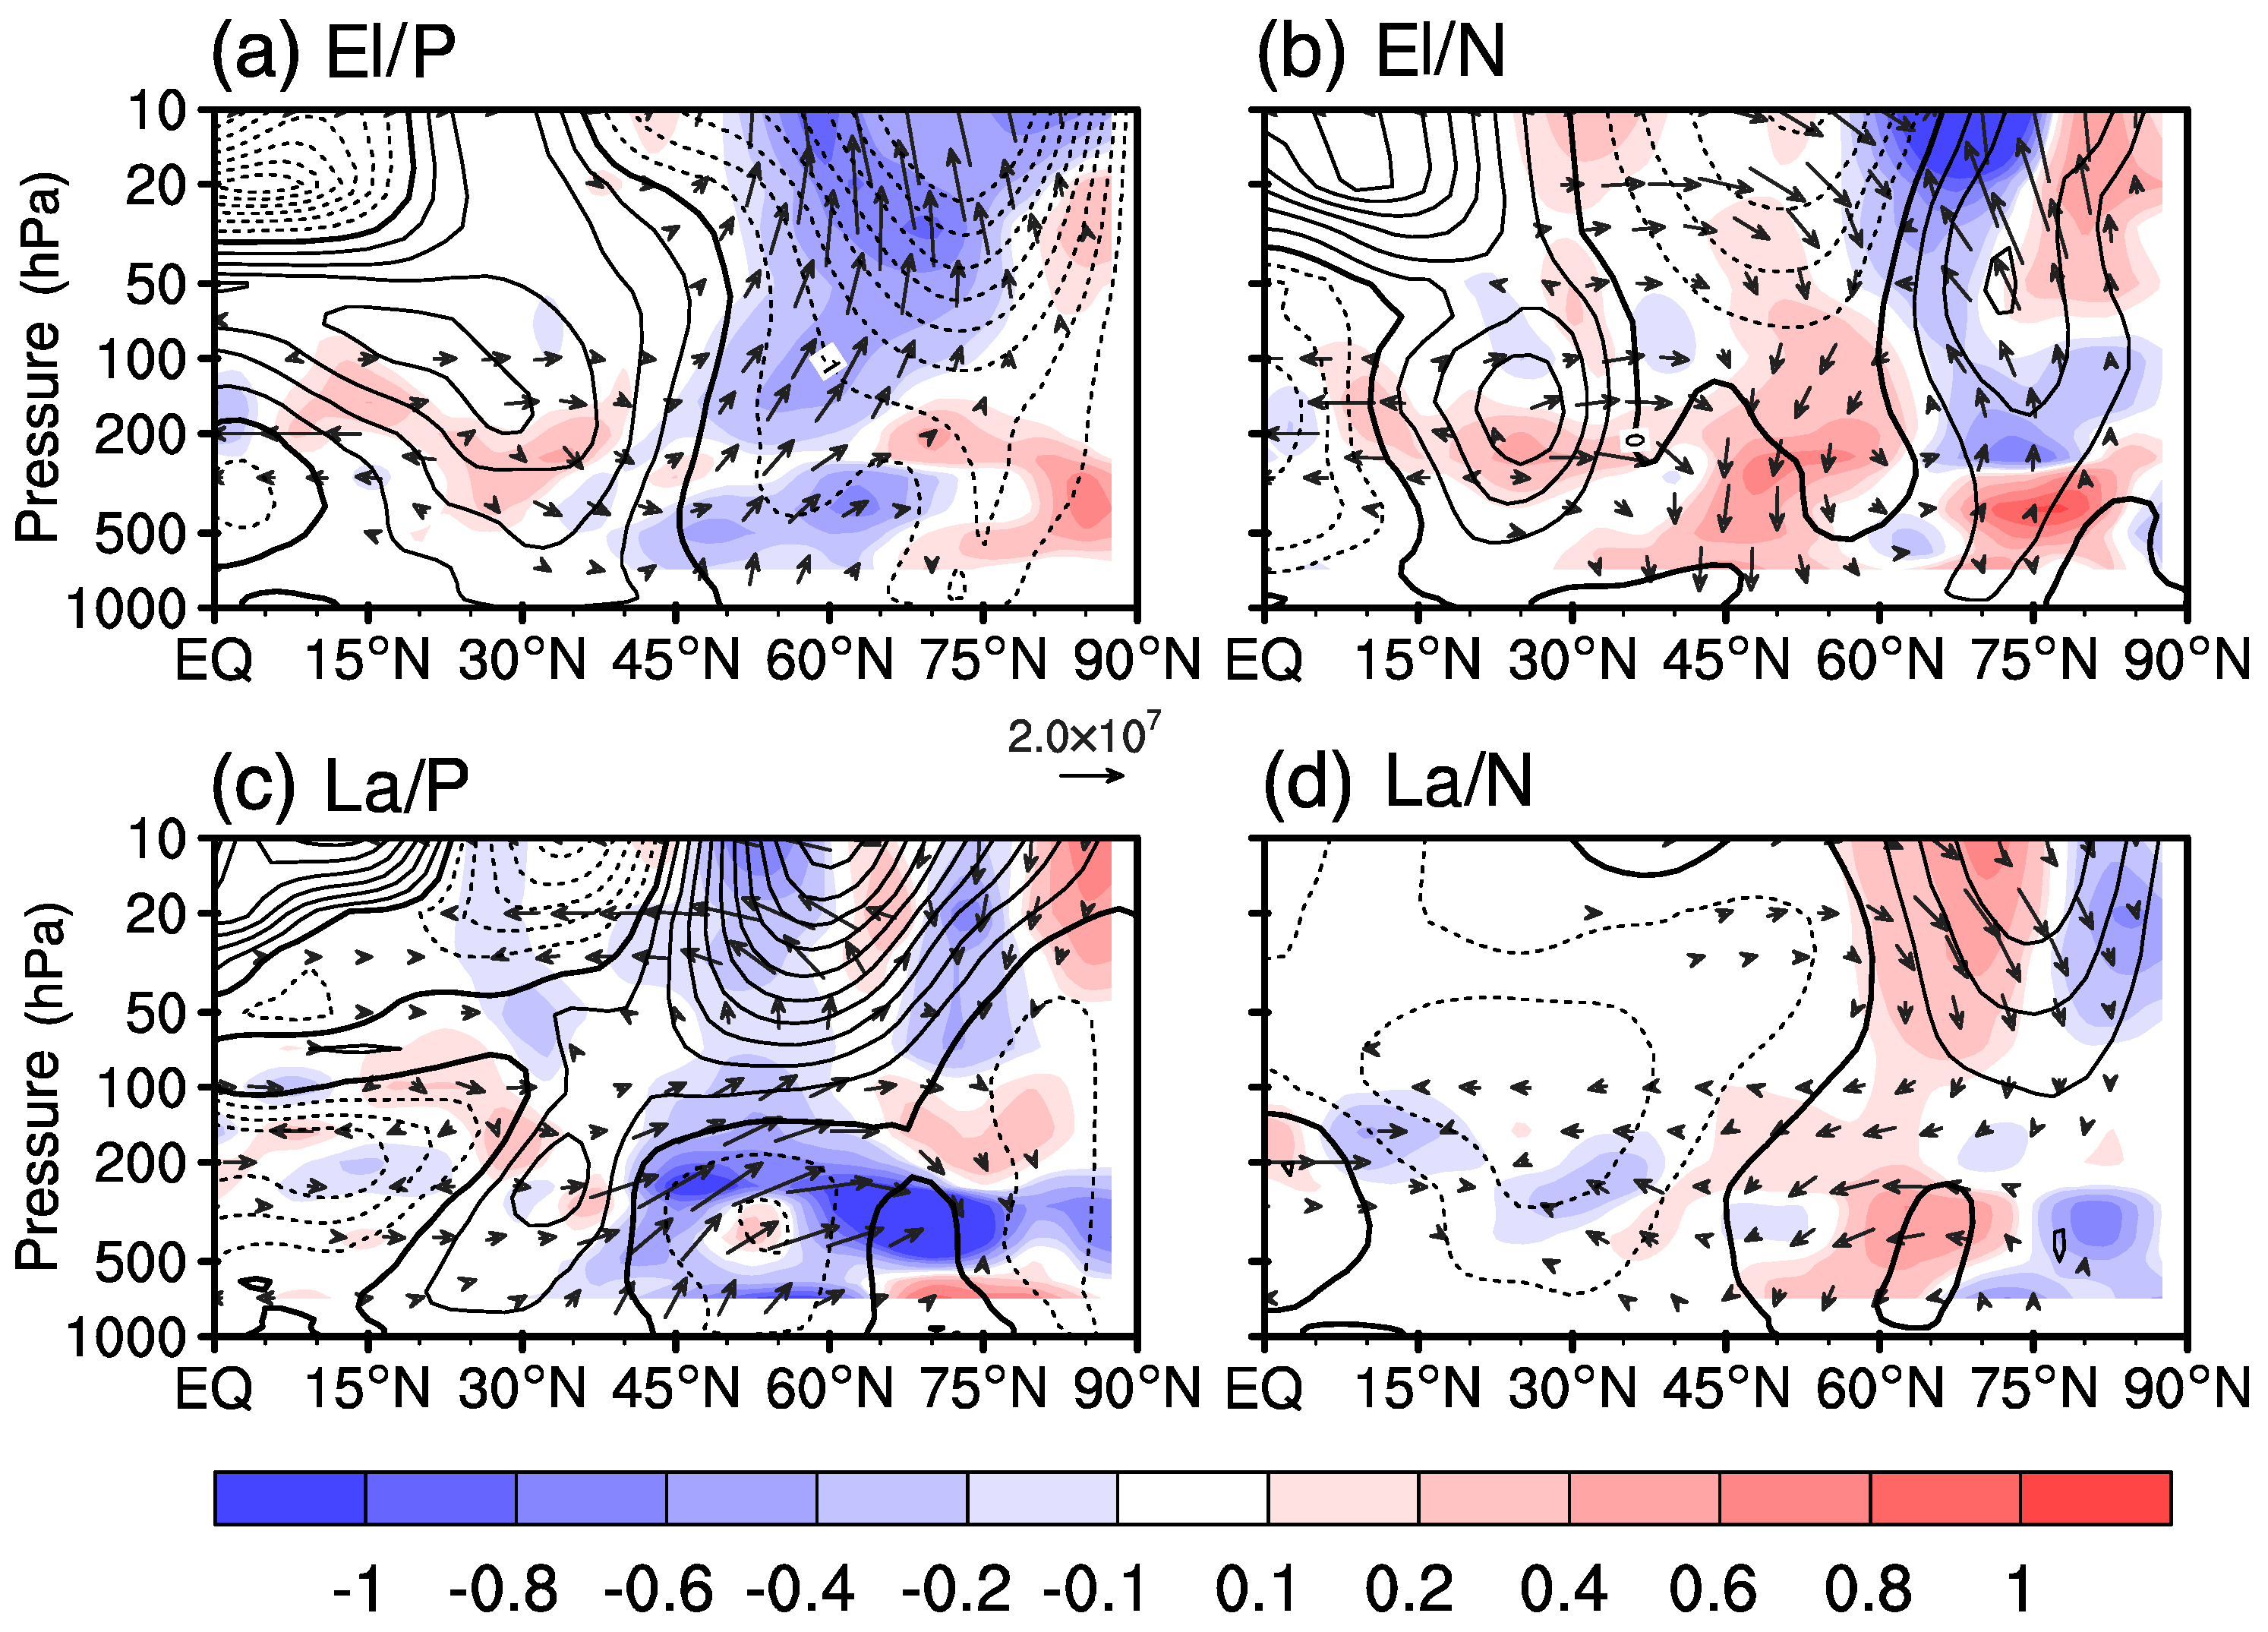
Disturbance of the Arctic stratospheric polar vortex results from the interference of anomalous waves propagating upward from the troposphere with the climatological troughs and ridges [1,3,9,19,29,59]. To better understand the disturbance of polar vortex by the interference of the tropospheric wave sources with the climatological zonal waves, the vertical cross section for the eddy height responses averaged in the mid-to-high latitudes (45–75° N) is shown in Figure 5 in the pressure-longitude plane for the four ENSO/PDO configurations. It can be seen that a negative tropospheric height anomaly center forms over the North Pacific near the date line during El Niño winters, but stronger during the positive PDO than during the negative PDO (Figure 5a,b). The North Pacific height anomaly center is projected onto the negative lobe of the PNA-like response (Figure 3a,b and Figure 4a,b), and it is located near the climatological trough. The projected wavenumber–1 response is in phase with the climatological wavenumber–1 (shadings) to enhance the total waves during El Niño winters. In contrast, the wavenumber–1 response is stronger in El/P winters than in El/N winters (Figure 5e,f). Both the eddy height response and its zonal wavenumber–1 tilt westward, indicating an enhanced upward propagation of planetary waves. The extratropical height response to La Niña during the positive PDO is fairly different from that during the negative PDO (Figure 5c,d). The extratropical eddy height response lags the climatological waves in La/P winters, whereas the wave response in La/N winters is nearly a mirror image of the wave response in El/P winters. It is also seen that the wavenumber–1 component and its climatology are in quadrature in La/P winters, but the wave response is out of phase with its climatology in La/N winters (Figure 5g,h).
4.2. Upward Propagation of Planetary Waves and Stratospheric Response
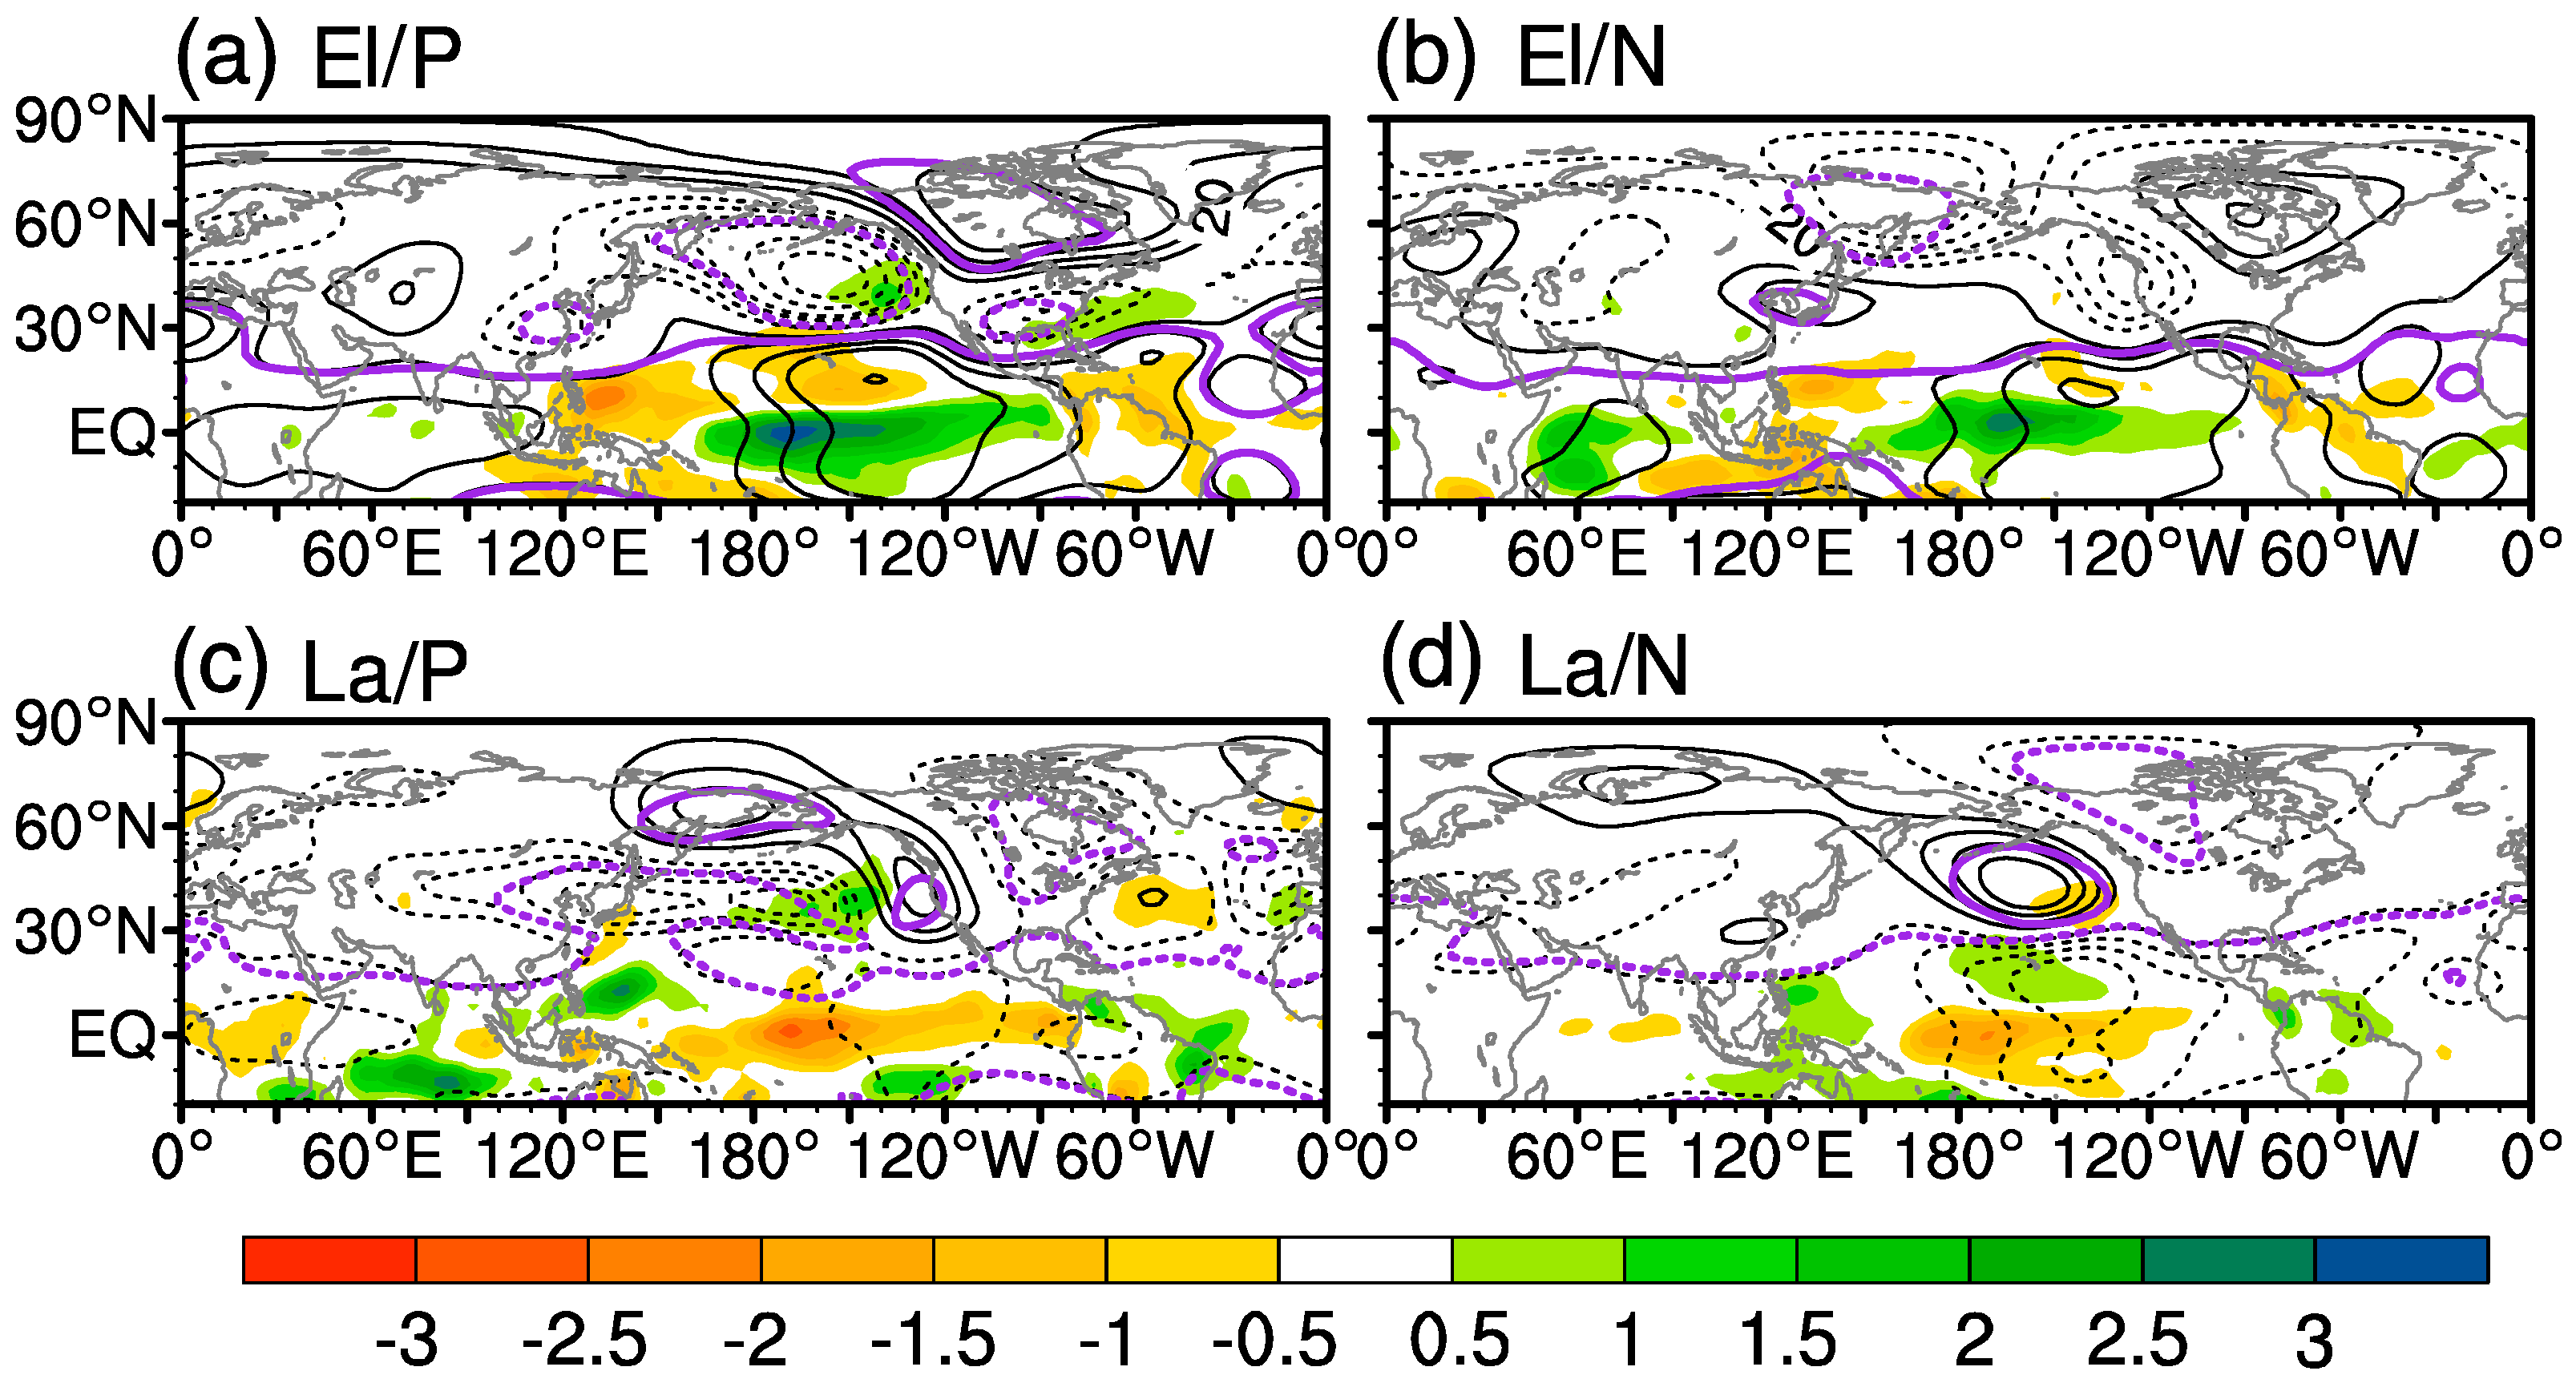
Figure 6 presents the composite Eliassen–Palm (E–P) flux anomalies and the E–P flux divergence [60] to demonstrate the upward propagation and dissipation of planetary waves from the troposphere to stratosphere. Consistent with the positive PNA response in the troposphere in El Niño winters, the planetary wave activity is intensified, and its upward propagation is strengthened in the mid-to-high latitudes (Figure 6a,b). The upward propagation of waves in mid-to-high latitudes is more uniform and more intense in El/P winters than in El/N winters (Figure 6a,b), consistent with the larger easterly anomalies in the circumpolar region in El/P winters. The stratospheric polar vortex response to El Niño is sensitive to the PDO phase: When the cold mean state appears in the North Pacific as during the positive PDO, the enhanced SST meridional gradient can strengthen the extratropical response to tropical SST anomalies. For example, Hu et al. [57] reported that the northern winter stratospheric response to an ocean forcing with maximum SST warming in the tropics that decreases with latitude in both hemispheres is usually stronger than the response to a uniform SST warming pattern.
Similarly, the suppressed upward propagation of planetary waves and the positive E–P flux divergence anomalies in the circumpolar region is more significant in La/N winters than in La/P winters (cf. Figure 6c,d). The strengthened polar jet response in the circumpolar region is found to appear in La/N winters and in La/P winters. We find the polar night jet in La/P winters seemingly exhibits a southward shift and the response is much stronger than other configurations of ENSO and PDO (Figure 6c). The La/P case number is relatively small than other configurations, and the strong zonal wind response in the composite might reflect the large internal variation of the stratospheric polar vortex. As the North Pacific height response is generally symmetric between El/P and La/N winters, the stratospheric polar vortex response pattern is largely similar but with the sign reversed (Figure 6a,d).
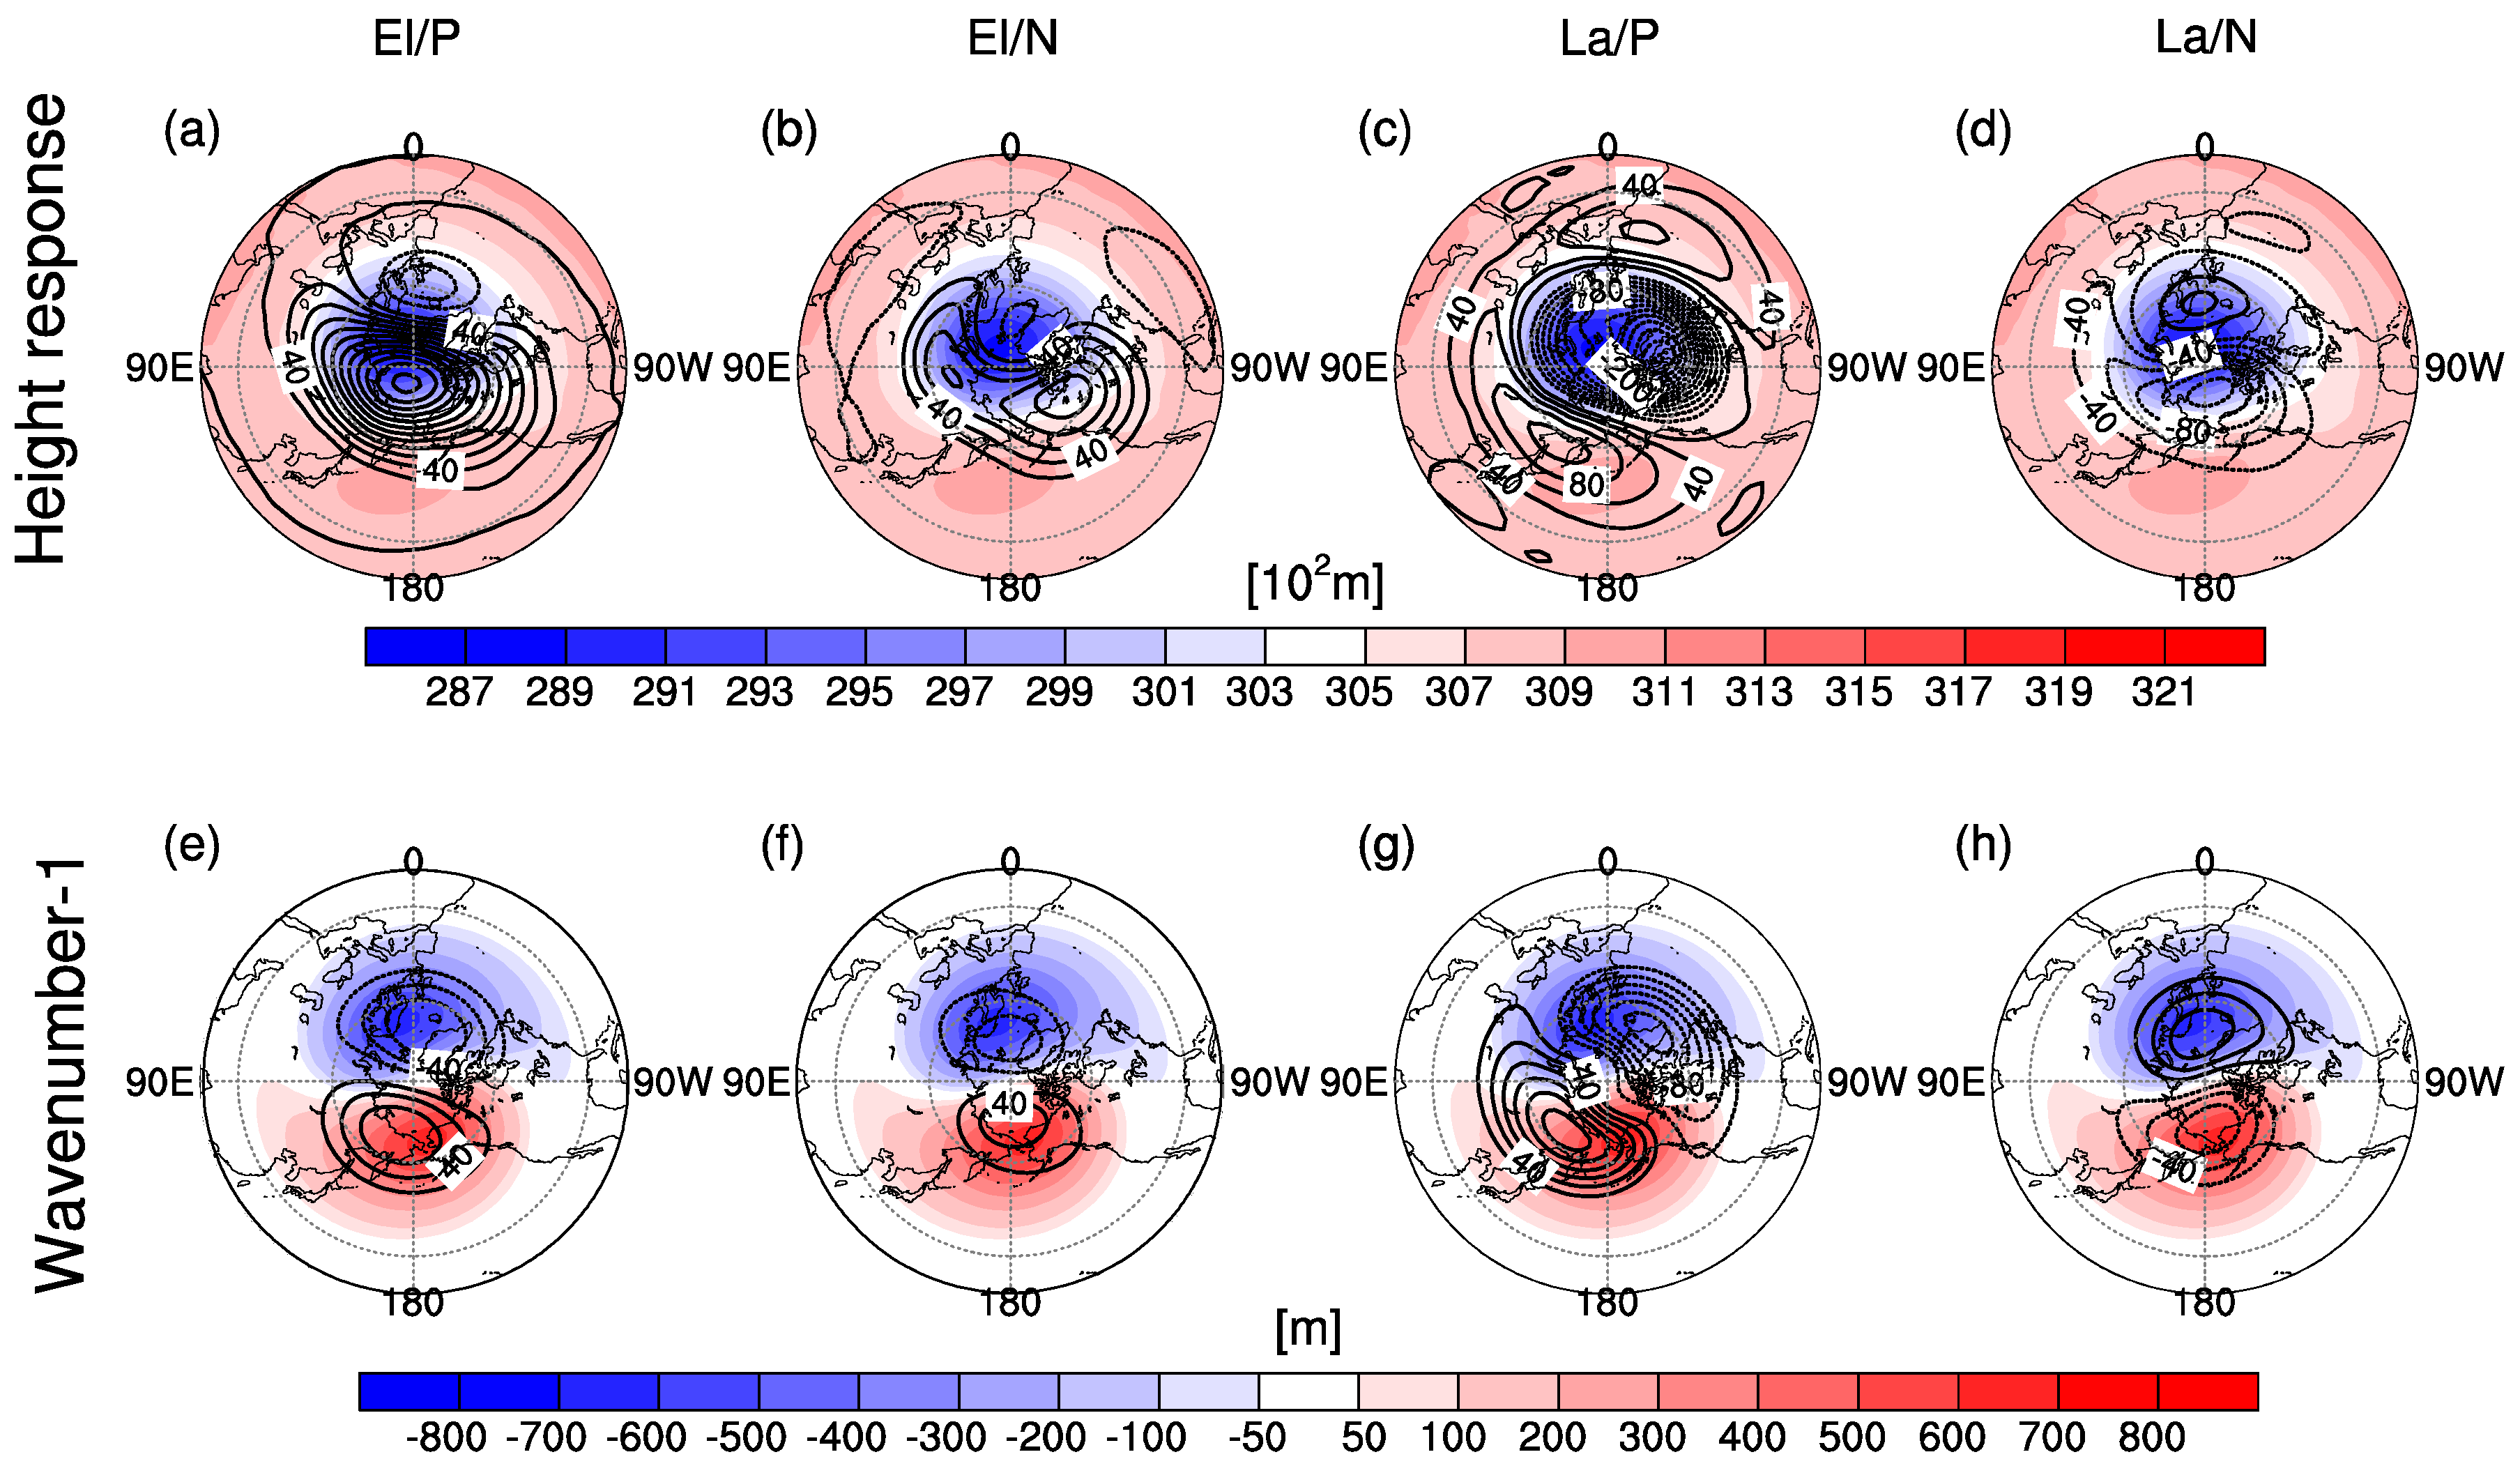
To easily compare the disturbances of the stratospheric circulation related to the anomalous upward propagation of waves originating from the troposphere, Figure 7 shows the composite height response and its zonal wavenumber–1 component at 10 hPa. Consistent with Figure 6a,b, the positive height response in the Arctic stratosphere is stronger in El/P winters than in El/N winters (Figure 7a,b), and so is the wavenumber–1 response (Figure 7e,f). This infers once again that the stratospheric polar vortex response to El Niño varies with the PDO phase. The wavenumber–1 response is in phase with its climatology and favors the displacement of the stratospheric polar vortex toward the Atlantic sector where the negative height anomaly and negative lobe of the wavenumber–1 prevail. However, the stratospheric polar vortex responses to La Niña during the positive and negative PDO phases show little similarity. The orthogonal distribution of wavenumber–1 with its climatology observed in the extratropical eddy height response (Figure 5c,g) also appears in the height response at 10 hPa (Figure 7c,g). In contrast, the height response pattern in La/N winters is generally symmetric to that in El/P winters (Figure 7a,d). The wavenumber–1 response in La/N winters is nearly out of phase with that in El/P and El/N winters.
4.3. A Comprehensive View
The scatterplots of the ENSO index versus the stratospheric polar cap temperature (Tpole; 70–20 hPa, 60–90° N), stratospheric circumpolar westerly jet (Upole; 50–10 hPa, 65–75° N), PNA index, and Western Pacific (WP) index are shown in Figure 8 during all winters from the observations. The PNA and WP indices were also adopted to study the predictability of sudden stratospheric warming events and its tropospheric precursors [61,62]. The linear relationship between each indicator and Niño3 index is regressed respectively for warm (Niño3 > 0) and cold (Niño3 < 0) ENSO states and for positive (red) and negative (blue) PDO phases, respectively. Because super El Niño events might have a different impact on the northern winter stratosphere from that of moderate El Niño events [13,15,16], the three super El Niño events (Niño3 > 2.5 °C) in the 1982/83, 1997/98, and 2015/16 winters as extreme outliers were excluded to construct the linear relationship between ENSO and the four indicators. The stratospheric polar cap temperature anomaly tends to be warm in most moderate warm ENSO winters especially when ENSO and PDO are in phase. On the contrary, it tends to be cold in cold ENSO winters when ENSO and PDO are in phase (Figure 8a). The linkage between super El Niño events and Tpole is weak, and the polar cap temperature is anomalously weak in two of the super El Niño winters. The regressed relationship between warm (cold) ENSO and Tpole during positive (negative) PDO shows a positive slope. It is also noticed that most points for Upole is negative especially when both PDO and ENSO are positive, and vice versa, when the PDO and ENSO indices are negative (Figure 8b). In contrast, the points are more scattered and the linear correlation between ENSO and Upole is weak when the PDO and ENSO indices are out of phase.
As previous studies [3,14,21] reported, one of the ENSO teleconnections, the PNA, can bridge the stratospheric polar vortex response to ENSO. Most points for PNA are mainly scattered above (below) the zero line when both ENSO and PDO are positive (negative), while the PNA coordinates are homogeneously distributed above and below the zero line and the ENSO–PNA correlation is also weak when ENSO and PDO are out of phase (Figure 8c). The other ENSO teleconnection, the WP is less sensitive to the phase of ENSO and PDO. For example, during the positive PDO, the regressed line slopes for warm and cold ENSO states are nearly the same (red lines in Figure 8d). The regression lines for cold ENSO states during positive and negative PDO are nearly parallel (blue lines in Figure 8d). It may be inferred that the unstable relationship between ENSO and the northern winter stratosphere is mainly explained by the PNA response. The consistent dynamic response between the troposphere and stratosphere provides evidence for the possible contribution of the PDO to the unstable relationship between ENSO and the northern winter stratosphere.
5. Summary and Discussion
Recent studies have indicated the unstable relationship between ENSO and the norther winter stratospheric polar vortex. The northern winter stratospheric response to El Niño has been weakening in the past decades. Using the NCEP/NCAR reanalysis and HadISST analysis data, we explore in this study the possible modulation of the ENSO–northern winter stratosphere relationship by the PDO, which exerts an impact on SST mean state in the North Pacific on an interdecadal timescale. El Niño and La Niña events show large asymmetry in the positive and negative PDO phases, respectively. In general, El Niño events usually occur more frequently than La Niña events in the positive PDO, whereas more La Niña events appear in the negative PDO than El Niño events. Furthermore, the average El Niño intensity is larger in the positive PDO than in the negative PDO, whereas the average La Niña intensity is larger in the negative PDO than in the negative PDO.
As the composite El Niño is stronger in the positive PDO than in the negative PDO, the tropical precipitation response is stronger in El/P winters than in El/N winters. The positive PNA response to El Niño and the negative height anomalies over the North Pacific are much larger and more significant in El/P winters than in El/N winters. The asymmetric behaviors of El Niño events between the positive and negative PDO phases may partially explain the unstable stratospheric response to El Niño. The extratropical SST anomalies in El Niño winters that can be superimposed by the positive PDO or undermined by the negative PDO dominate more in locking the height response over the North Pacific and therefore the positive PNA response. Therefore, the passages for the upward propagation of waves from the troposphere is more unimpeded over the western coast of the North American continents and East Asia when the PDO is in its positive phase than in its negative phase. However, it is also revealed that the negative height response over the North Pacific also appears in La Niña winters when the PDO is positive, which may imply that the extratropical cold SST anomalies in the North Pacific associated with the positive PDO overwhelm the tropical cold SST anomalies associated with La Niña in determining the height anomaly pattern. In contrast, the negative PNA response forms and the upward propagation of waves in the western coast of North America and East Asia is suppressed in La/N winters, which is nearly symmetric to the response in El/P winters.
The negative height response over the North Pacific is mainly projected to the wavenumber–1 in El/P winters, which shows a westward tilt from the troposphere to the stratosphere and favors its upward propagation. The enhanced upward-propagating waves dissipate in the mid-to-high latitude stratosphere, weakening the stratospheric polar vortex. As the positive PNA response to El Niño is diminished in the negative PDO phase, and the enhanced upward propagation of the extratropical waves is limited. In comparison, the weakening of the stratospheric polar vortex in El/N winter is less significant than in El/P winters. It is not found that the extratropical height response to La Niña should weaken the climatological waves from the troposphere to the stratosphere: the wavenumber–1 response in La/N winters seems to be in quadrature with its climatology. In contrast, consistent with the negative PNA response, a weakened wavenumber–1 pattern forms in La/N winters, and the upward propagation of waves is largely suppressed in the mid-to-high latitudes, leading to a stronger polar vortex response.
The composite stratospheric El Niño signal may have been entangled with other external factors like the QBO and solar cycle from the relatively short observations. Because limited ENSO cases can be selected from observations, model evidence is required to further confirm the modulation of the stratospheric ENSO teleconnection by PDO. The PDO can change the mean SST state in tropical Pacific where ENSO occurs, leading to the asymmetry of ENSO’s intensity and frequency in different PDO phase. Recent studies also found an asymmetric response of the stratospheric temperature to ENSO [15,16,17]. It was reported that El Niño has a stronger impact on the northern winter stratosphere than La Niña does. Our result also shows a stronger stratospheric response to El Niño than to La Niña, but this conclusion may be only true when the PDO index is high. This asymmetry can be possibly reversed if the PDO index is low. Moreover, the modulation of PDO on the stratospheric ENSO pathway may explain the weakening of the stratospheric El Niño signal in recent decades [47]. Actually, the PDO is not the only SST mode that can modulate the interdecadal change of ENSO teleconnection. The Atlantic multidecadal oscillation can also affect the tropospheric ENSO’s impact on the global climate, so its modulation on the stratospheric ENSO teleconnection also deserves further investigation in the future study.
Although we use the NCEP/NCAR reanalysis, which is longer than other reanalyses, the sample size for different ENSO/PDO configurations is still small, especially for El/N and La/P configurations. However, our results are highly consistent with a previous modeling study by Kren et al. [63]. Using a 200-year preindustrial simulation by WACCM [63], a relationship between the positive PDO and the weak stratospheric polar vortex is established. Based on a 2000-year simulation dataset, the modulation of PDO on the stratospheric ENSO teleconnection might be confirmed in our multi-model study (Rao et al., submitted to Journal of Climate).
Author Contributions
Conceptualization, J.R. and R.R.; methodology, J.R.; software, J.R. and X.X.; validation, C.S. and D.G.; formal analysis, J.R. and R.R.; investigation, J.R.; writing—original draft preparation, J.R.; writing—review and editing, R.R.; visualization, X.X.; supervision, R.R.; project administration, R.R. and C.S.
Funding
This work was jointly supported by grants from the National Natural Science Foundation of China (41705024, 41875048), the Strategic Priority Research Program of Chinese Academy of Sciences (XDA17010105), the National Key R&D Program of China (2016YFA0602104), and the Startup Foundation for Introducing Talent of NUIST (2016r060).
Acknowledgments
We acknowledge the NCEP/NCAR (https://www.esrl.noaa.gov/psd/data/gridded/data.ncep.reanalysis.pressure.html) and Hadley Centre (https://www.metoffice.gov.uk/hadobs/hadisst/data/download.html) for providing the reanalysis and SST, respectively.
Conflicts of Interest
The authors declare no conflict of interest.
References
- Manzini, E.; Giorgetta, M.A.; Esch, M.; Kornblueh, L.; Roeckner, E. The influence of sea surface temperatures on the northern winter stratosphere: Ensemble simulations with the MAECHAM5 model. J. Clim. 2006, 19, 3863–3881. [Google Scholar] [CrossRef]
- Garfinkel, C.I.; Hartmann, D.L. Effects of the El-Niño Southern Oscillation and the Quasi-Biennial Oscillation on polar temperatures in the stratosphere. J. Geophys. Res. 2007, 112, D19112. [Google Scholar] [CrossRef]
- Garfinkel, C.I.; Hartmann, D.L. Different ENSO teleconnections and their effects on the stratospheric polar vortex. J. Geophys. Res. 2008, 113, D18114. [Google Scholar] [CrossRef]
- Free, M.; Seidel, D.J. Observed El Niño–Southern Oscillation temperature signal in the stratosphere. J. Geophys. Res. 2009, 114, D23108. [Google Scholar] [CrossRef]
- Xie, F.; Li, J.; Tian, W.; Feng, J.; Huo, Y. Signals of El Niño Modoki in the tropical tropopause layer and stratosphere. Atmos. Chem. Phys. 2012, 12, 5259–5273. [Google Scholar] [CrossRef] [Green Version]
- Sassi, F.; Kinnison, D.; Boville, B.A.; Garcia, R.R.; Roble, R. Effect of El Niño-Southern Oscillation on the dynamical, thermal, and chemical structure of the middle atmosphere. J. Geophys. Res. 2004, 109, D17108. [Google Scholar] [CrossRef]
- García-Herrera, R.; Calvo, N.; Garcia, R.R.; Giorgetta, M.A. Propagation of ENSO temperature signals into the middle atmosphere: A comparison of two general circulation models and ERA-40 reanalysis data. J. Geophys. Res. 2006, 111, D06101. [Google Scholar] [CrossRef]
- Taguchi, M.; Hartmann, D.L. Increased occurrence of stratospheric sudden warmings during El Niño as simulated by WACCM. J. Clim. 2006, 19, 324–332. [Google Scholar]
- Ineson, S.; Scaife, A.A. The role of the stratosphere in the European climate response to El Niño. Nat. Geosci. 2008, 2, 32–36. [Google Scholar] [CrossRef]
- Bell, C.J.; Gray, L.J.; Charlton-Perez, A.J.; Joshi, M.M.; Scaife, A.A. Stratospheric communication of El Niño teleconnections to European winter. J. Clim. 2009, 22, 4083–4096. [Google Scholar] [CrossRef]
- Cagnazzo, C.; Manzini, E. Impact of the stratosphere on the winter tropospheric teleconnections between ENSO and the North Atlantic and European region. J. Clim. 2009, 22, 1223–1238. [Google Scholar] [CrossRef]
- Cagnazzo, C.; Manzini, E.; Calvo, N.; Douglass, A.; Akiyoshi, H.; Bekki, S.; Chipperfield, M.; Dameris, M.; Deushi, M.; Fischer, A.M.; et al. Northern winter stratospheric temperature and ozone responses to ENSO inferred from an ensemble of chemistry climate models. Atmos. Chem. Phys. 2009, 9, 8935–8948. [Google Scholar] [CrossRef]
- Rao, J.; Ren, R. Parallel comparison of the 1982/83, 1997/98, and 2015/16 super El Niños and their effects on the extratropical stratosphere. Adv. Atmos. Sci. 2017, 34, 1121–1133. [Google Scholar] [CrossRef]
- Rao, J.; Ren, R. Varying stratospheric responses to tropical Atlantic SST forcing from early to late winter. Clim. Dyn. 2018, 51, 2079–2096. [Google Scholar] [CrossRef]
- Rao, J.; Ren, R. Asymmetry and nonlinearity of the influence of ENSO on the northern winter stratosphere: 1. Observations. J. Geophys. Res. Atmos. 2016, 121, 9000–9016. [Google Scholar] [CrossRef]
- Rao, J.; Ren, R. Asymmetry and nonlinearity of the influence of ENSO on the northern winter stratosphere: 2. Model study with WACCM. J. Geophys. Res. Atmos. 2016, 121, 9017–9032. [Google Scholar] [CrossRef]
- Xie, F.; Zhou, X.; Li, J.; Sun, C.; Feng, J.; Ma, X. The key role of background sea surface temperature over the cold tongue in asymmetric responses of the Arctic stratosphere to El Niño–Southern Oscillation. Environ. Res. Lett. 2018, 13, 114007. [Google Scholar] [CrossRef]
- Rao, J.; Ren, R. A decomposition of ENSO’s impacts on the northern winter stratosphere: Competing effect of SST forcing in the tropical Indian Ocean. Clim. Dyn. 2016, 46, 3689–3707. [Google Scholar] [CrossRef]
- Ren, R.; Rao, J.; Wu, G.; Cai, M. Tracking the delayed response of the northern winter stratosphere to ENSO using multi reanalyses and model simulations. Clim. Dyn. 2017, 48, 2859–2879. [Google Scholar] [CrossRef]
- Annamalai, H.; Okajima, H.; Watanabe, M. Possible impact of the Indian Ocean SST on the northern hemisphere circulation during El Niño. J. Clim. 2007, 20, 3164–3189. [Google Scholar] [CrossRef]
- Fletcher, C.G.; Kushner, P.J. The role of linear interference in the annular mode response to tropical SST forcing. J. Clim. 2011, 24, 778–794. [Google Scholar] [CrossRef]
- Meehl, G.A.; Teng, H.Y. Multi-model changes in El Niño teleconnections over North America in a future warmer climate. Clim. Dyn. 2007, 29, 779–790. [Google Scholar] [CrossRef]
- Zhou, Z.; Xie, S.; Zheng, X.; Liu, Q.; Wang, H. Global warming–induced changes in El Niño teleconnections over the North Pacific and North America. J. Clim. 2014, 27, 9050–9064. [Google Scholar] [CrossRef]
- Wittenberg, A.T. Are historical records sufficient to constrain ENSO simulations? Geophys. Res. Lett. 2009, 36, L12702. [Google Scholar] [CrossRef]
- Deser, C.; Phillips, A.S.; Alexander, M.A. Twentieth century tropical sea surface temperature trends revisited. Geophys. Res. Lett. 2010, 37, L10701. [Google Scholar] [CrossRef]
- Müller, W.A.; Roeckner, E. ENSO teleconnections in projections of future climate in ECHAM5/MPI-OM. Clim. Dyn. 2008, 31, 533–549. [Google Scholar] [CrossRef] [Green Version]
- Bulić, I.H.; Branković, Č.; Kucharski, F. Winter ENSO teleconnections in a warmer climate. Clim. Dyn. 2012, 38, 1593–1613. [Google Scholar] [CrossRef]
- Taylor, K.E.; Stouffer, R.J.; Meehl, G.A. An overview of CMIP5 and the experiment design. Bull. Am. Meteorol. Soc. 2012, 93, 485–498. [Google Scholar] [CrossRef]
- Garfinkel, C.I.; Hartmann, D.L.; Sassi, F. Tropospheric precursors of anomalous Northern Hemisphere stratospheric polar vortices. J. Clim. 2010, 23, 3282–3299. [Google Scholar] [CrossRef]
- Newman, M.; Compo, G.P.; Alexander, M.A. ENSO-forced variability of the Pacific Decadal Oscillation. J. Clim. 2003, 16, 3853–3857. [Google Scholar] [CrossRef]
- Newman, M.; Alexander, M.A.; Ault, T.R.; Cobb, K.M.; Deser, C.; Di Lorenzo, E.; Mantua, N.J.; Miller, A.J.; Minobe, S.; Nakamura, H.; et al. The Pacific Decadal Oscillation, revisited. J. Clim. 2016, 29, 4399–4427. [Google Scholar] [CrossRef]
- Schneider, N.; Cornuelle, B.D. The forcing of the Pacific Decadal Oscillation. J. Clim. 2005, 18, 4355–4373. [Google Scholar] [CrossRef]
- Shakun, J.D.; Shaman, J. Tropical origins of North and South Pacific decadal variability. Geophys. Res. Lett. 2009, 36, L19711. [Google Scholar] [CrossRef]
- Zhang, Y.; Wallace, J.W.; Battisti, D.S. ENSO-like interdecadal variability: 1900–93. J. Clim. 1997, 10, 1004–1020. [Google Scholar] [CrossRef]
- Hu, D.; Guan, Z. Decadal relationship between the stratospheric Arctic vortex and Pacific Decadal Oscillation. J. Clim. 2018, 31, 3371–3386. [Google Scholar] [CrossRef]
- Verdon, D.C.; Franks, S.W. Long-term behaviour of ENSO: Interactions with the PDO over the past 400 years inferred from paleoclimate records. Geophys. Res. Lett. 2006, 33, L06712. [Google Scholar] [CrossRef]
- Papineau, J.M. Wintertime temperature anomalies in Alaska correlated with ENSO and PDO. Int. J. Climatol. 2001, 21, 1577–1592. [Google Scholar] [CrossRef] [Green Version]
- Schoennagel, T.; Veblen, T.T.; Romme, W.H.; Sibold, J.S.; Cook, E.R. ENSO and PDO variability affect drought-induced fire occurrence in Rocky Mountain subalpine forests. Ecol. Appl. 2005, 15, 2000–2014. [Google Scholar] [CrossRef]
- Brönnimann, S.; Xoplaki, E.; Casty, C.; Pauling, A.; Luterbacher, J. ENSO influence on Europe during the last centuries. Clim. Dyn. 2006, 28, 181–197. [Google Scholar] [CrossRef]
- Pavia, E.G.; Graef, F.; Reyes, J. PDO-ENSO effects in the climate of Mexico. J. Clim. 2006, 19, 6433–6438. [Google Scholar] [CrossRef]
- Yu, B.; Zwiers, F.W. The impact of combined ENSO and PDO on the PNA climate: A 1000-year climate modeling study. Clim. Dyn. 2007, 29, 837–851. [Google Scholar] [CrossRef]
- Veettil, B.K.; Maier, E.E.L.B.; Bremer, U.F.; de Souza, S.F. Combined influence of PDO and ENSO on northern Andean glaciers: A case study on the Cotopaxi ice-covered volcano, Ecuador. Clim. Dyn. 2014, 43, 3439–3448. [Google Scholar] [CrossRef]
- Zhou, W.; Wang, X.; Zhou, T.J.; Li, C.; Chan, J.C.L. Interdecadal variability of the relationship between the East Asian winter monsoon and ENSO. Meteorol. Atmos. Phys. 2014, 98, 283–293. [Google Scholar] [CrossRef]
- Zanchettin, D.; Franks, S.W.; Traverso, P.; Tomasino, M. On ENSO impacts on European wintertime rainfalls and their modulation by the NAO and the Pacific multi-decadal variability described through the PDO index. Int. J. Climatol. 2008, 28, 995–1006. [Google Scholar] [CrossRef] [Green Version]
- Xiao, M.; Zhang, Q.; Singh, V.P. Influences of ENSO, NAO, IOD and PDO on seasonal precipitation regimes in the Yangtze River basin, China. Int. J. Climatol. 2015, 35, 3556–3567. [Google Scholar] [CrossRef]
- Wu, X.; Mao, J. Interdecadal modulation of ENSO-related spring rainfall over South China by the Pacific Decadal Oscillation. Clim. Dyn. 2016, 47, 3203–3220. [Google Scholar] [CrossRef]
- Yuan, J.; Tan, B.; Feldstein, S.B.; Lee, S. Wintertime North Pacific teleconnection patterns: Seasonal and interannual variability. J. Clim. 2015, 28, 8247–8263. [Google Scholar] [CrossRef]
- Hu, J.; Li, T.; Xu, H.; Yang, S. Lessened response of boreal winter stratospheric polar vortex to El Niño in recent decades. Clim. Dyn. 2017, 49, 263–278. [Google Scholar] [CrossRef]
- Kalnay, E.; Kanamitsu, M.; Kistler, R.; Collins, W.; Deaven, D.; Gandin, L.; Iredell, M.; Saha, S.; White, G.; Woollen, J.; et al. The NCEP/NCAR 40-year reanalysis project. Bull. Am. Meteorol. Soc. 1996, 77, 437–471. [Google Scholar] [CrossRef]
- Rao, J.; Ren, R.; Yang, Y. Parallel comparison of the northern winter stratospheric circulation in reanalysis and in CMIP5 models. Adv. Atmos. Sci. 2015, 32, 952–966. [Google Scholar] [CrossRef]
- Rayner, N.A.A.; Parker, D.E.; Horton, E.B.; Folland, C.K.; Alexander, L.V.; Rowell, D.P.; Kent, E.C.; Kaplan, A. Global analyses of sea surface temperature, sea ice, and night marine air temperature since the late nineteenth century. J. Geophys. Res. 2003, 108, 4407. [Google Scholar] [CrossRef]
- Wei, K.; Chen, W.; Huang, R. Association of tropical Pacific sea surface temperatures with the stratospheric Holton-Tan Oscillation in the Northern Hemisphere winter. Geophys. Res. Lett. 2007, 34, L16814. [Google Scholar] [CrossRef]
- Calvo, N.; Giorgetta, M.A.; Garcia-Herrera, R.; Manzini, E. Nonlinearity of the combined warm ENSO and QBO effects on the Northern Hemisphere polar vortex in MAECHAM5 simulations. J. Geophys. Res. 2009, 114, D13109. [Google Scholar] [CrossRef]
- Garfinkel, C.I.; Hartmann, D.L. Influence of the quasi-biennial oscillation on the North Pacific and El Niño teleconnections. J. Geophys. Res. 2010, 115, D20116. [Google Scholar] [CrossRef]
- Cheung, H.H.N.; Zhou, W.; Leung, M.Y.T.; Shun, C.M.; Lee, S.M.; Tong, H.W. A strong phase reversal of the Arctic Oscillation in midwinter 2015/2016: Role of the stratospheric polar vortex and tropospheric blocking. J. Geophys. Res. Atmos. 2016, 121, 13443–413457. [Google Scholar] [CrossRef]
- Mantua, N.J.; Hare, S.R.; Zhang, Y.; Wallace, J.M.; Francis, R.C. A Pacific interdecadal climate oscillation with impacts on salmon production. Bull. Am. Meteorol. Soc. 1997, 78, 1069–1079. [Google Scholar] [CrossRef]
- Hu, D.; Tian, W.; Xie, F.; Shu, J.; Dhomse, S. Effects of meridional sea surface temperature gradients on stratospheric temperature and circulation. Adv. Atmos. Sci. 2014, 31, 888–900. [Google Scholar] [CrossRef]
- Plumb, R.A. On the three-dimensional propagation of stationary waves. J. Atmos. Sci. 1985, 42, 217–229. [Google Scholar] [CrossRef]
- Camp, C.D.; Tung, K.K. Stratospheric polar warming by ENSO in winter: A statistical study. Geophys. Res. Lett. 2007, 34, L04809. [Google Scholar] [CrossRef]
- Andrews, D.G.; Holton, J.R.; Leovy, C.B. Middle Atmosphere Dynamics; Academic press: San Diego, CA, USA, 1987; p. 489. [Google Scholar]
- Rao, J.; Ren, R.; Chen, H.; Yue, Y.; Zhou, Y. The stratospheric sudden warming event in February 2018 and its prediction by a climate system model. J. Geophys. Res. Atmos. 2018, 123, 13332–13345. [Google Scholar] [CrossRef]
- Rao, J.; Ren, R.; Chen, H.; Liu, X.; Yu, Y.; Yang, Y. Sub-seasonal to seasonal hindcasts of stratospheric sudden warming by BCC_CSM1.1(m): A comparison with ECMWF. Adv. Atmos. Sci. 2019, 36, 479–494. [Google Scholar] [CrossRef]
- Kren, A.C.; Marsh, D.R.; Smith, A.K.; Pilewskie, P. Wintertime Northern Hemisphere response in the stratosphere to the Pacific Decadal Oscillation using the Whole Atmosphere Community Climate Model. J. Clim. 2016, 29, 1031–1049. [Google Scholar] [CrossRef]
Figure 1.
(a) Regressed sea surface temperature (SST) anomalies against the normalized PDO index defined as the first empirical orthogonal function (EOF) time series of the Pacific SST anomalies poleward of 20° N. (b) The normalized PDO index time series.
Figure 1.
(a) Regressed sea surface temperature (SST) anomalies against the normalized PDO index defined as the first empirical orthogonal function (EOF) time series of the Pacific SST anomalies poleward of 20° N. (b) The normalized PDO index time series.

Figure 2.
Composite SST anomalies during El Niño winters when the PDO is in its (a) positive and (b) negative phases. (c) The difference between (a) and (b). (d–f) As in (a–c) but for La Niña winters. (g,h) The half difference between El Niño and La Niña during the positive/negative phases of the PDO. (i) The half difference between (a) and (e). The black contours mark the SST anomalies at the 90% confidence level.

Figure 3.
Composite precipitation anomalies (shadings, units: mm d−1) and 200-hPa height anomalies (contours; units: gpm; interval: 10) during El Niño winters when the PDO is in its (a) positive and (b) negative phases and those during La Niña winters when the PDO is in its (c) positive and (d) negative phases. Purple contours mark the height anomalies at 90% confidence level.

Figure 4.
Composite 200-hPa height anomalies (contours; units: gpm; interval: 10) and 200-hPa wave activity flux anomalies (vectors for the horizontal component, units: m2 s−2; shadings for the vertical component, units: 10−2 m2 s−2) during El Niño winters when the PDO is in its (a) positive and (b) negative phases and those during La Niña winters when the PDO is in its (c) positive and (d) negative phases.

Figure 5.
Pressure–longitude cross-sections of composite eddy height anomalies averaged in the 45–75° N latitude band during El Niño winters when the PDO is in its (a) positive and (b) negative phases and those during La Niña winters when the PDO is in its (c) positive and (d) negative phases (contours; units: gpm; interval: 10). (e–h) As in (a–d) but for the zonal wavenumber-1 components. Shadings are the corresponding eddy height climatology (units: gpm) in the 45–75° N latitude band.

Figure 6.
Pressure–latitude cross-sections of composite zonal mean zonal wind anomalies (contours; units: m s−1; interval: 0.5), composite E–P flux anomalies (vectors; units: m3 s−2; normalized by local air density for clarity), and composite E–P flux divergence anomalies (shadings; units: m s−1 d−1) during El Niño winters when the PDO is in its (a) positive and (b) negative phases and those during La Niña winters when the PDO is in its (c) positive and (d) negative phases.

Figure 7.
Composite height anomalies at 10 hPa (top row) and the zonal wavenumber–1 components (bottom row) during El Niño winters when the PDO is in its (a,e) positive and (b,f) negative phases and those during La Niña winters when the PDO is in its (c,g) positive and (d,h) negative phases (contours; units: gpm; interval: 20; zero lines skipped for clarity). Shadings are the corresponding winter height climatology (units: gpm) at 10 hPa.

Figure 8.
Scatterplots of the normalized winter Niño3 index versus four indicators: (a) the normalized winter Tpole, (b) the normalized winter Upole, (c) the normalized winter PNA index, and (d) the normalized winter WP index when the PDO is in its positive (red) and negative (blue) phases. Blue/Red lines present the linear relationships between the winter Niño3 index and each of the four indicators when the PDO is in its positive/negative phase. Note that the warm and cold ENSO states are separately checked. The percentage of variance explained by Niño3 (R2) is printed in each plot for different ENSO/PDO configurations. The sample sizes for the four configurations are 20 (El/P, R2 ≥ 0.13 for α ≤ 0.1), 7 (El/N, R2 ≥ 0.38 for α ≤ 0.1), 11 (La/P, R2 ≥ 0.25 for α ≤ 0.1), and 31 (La/N, R2 ≥ 0.09 for α ≤ 0.1).


Table 1.
The El Niño–Southern Oscillation (ENSO) events classified by the Pacific Decadal Oscillation (PDO) phases in observations. El/La denotes El Niño/La Niña events in the first column. P/N denotes the positive/negative phases of the PDO.
Table 1.
The El Niño–Southern Oscillation (ENSO) events classified by the Pacific Decadal Oscillation (PDO) phases in observations. El/La denotes El Niño/La Niña events in the first column. P/N denotes the positive/negative phases of the PDO.
| ENSO/PDO Configuration | Winter | Composite Niño3 |
|---|---|---|
| El/P | 13 events (1957/58, 1965/66, 1969/70, 1976/77, 1982/83, 1986/87, 1987/88, 1991/92, 1997/98, 2002/03, 2009/10, 2014/15, 2015/16) | 1.30 K |
| El/N | 6 events (1951/52, 1963/64, 1968/69, 1972/73, 1994/95, 2006/07) | 0.76 K |
| La/P | 5 events (1983/84, 1984/85, 1985/86, 1995/96, 1996/97) | −0.70 K |
| La/N | 24 events (1949/50, 1950/51, 1954/55, 1955/56, 1956/57, 1962/63, 1964/65, 1966/67, 1967/68, 1970/71, 1971/72, 1973/74, 1974/75, 1975/76, 1988/89, 1998/99, 1999/00, 2000/01, 2005/06, 2007/08, 2008/09, 2010/11, 2011/12, 2012/13) | −0.91 K |
© 2019 by the authors. Licensee MDPI, Basel, Switzerland. This article is an open access article distributed under the terms and conditions of the Creative Commons Attribution (CC BY) license (http://creativecommons.org/licenses/by/4.0/).
Share and Cite
MDPI and ACS Style
Rao, J.; Ren, R.; Xia, X.; Shi, C.; Guo, D. Combined Impact of El Niño–Southern Oscillation and Pacific Decadal Oscillation on the Northern Winter Stratosphere. Atmosphere 2019, 10, 211. https://doi.org/10.3390/atmos10040211
AMA Style
Rao J, Ren R, Xia X, Shi C, Guo D. Combined Impact of El Niño–Southern Oscillation and Pacific Decadal Oscillation on the Northern Winter Stratosphere. Atmosphere. 2019; 10(4):211. https://doi.org/10.3390/atmos10040211
Chicago/Turabian StyleRao, Jian, Rongcai Ren, Xin Xia, Chunhua Shi, and Dong Guo. 2019. "Combined Impact of El Niño–Southern Oscillation and Pacific Decadal Oscillation on the Northern Winter Stratosphere" Atmosphere 10, no. 4: 211. https://doi.org/10.3390/atmos10040211
Note that from the first issue of 2016, this journal uses article numbers instead of page numbers. See further details here.