
Teleconnections of Large-Scale Climate Patterns to Regional Drought in Mid-Latitudes: A Case Study in Xinjiang, China


1
College of Hehai, Chongqing Jiaotong University, Chongqing 400074, China
2
National Engineering Research Center for Inland Waterway Regulation, Chongqing 400074, China
*
Author to whom correspondence should be addressed.
Atmosphere 2022, 13(2), 230; https://doi.org/10.3390/atmos13020230
Submission received: 31 December 2021
/
Revised: 25 January 2022
/
Accepted: 27 January 2022
/
Published: 29 January 2022
(This article belongs to the Special Issue ENSO Atmospheric Teleconnections to the Mid-to-High Latitudes)
Abstract
:Drought is one of the most important environmental disasters. Assessment of the effects of oceanic atmospheric oscillations upon regional drought behavior has valuable implications for water resources management, especially for arid regions. This study aims to explore the climate drivers of drought conditions in Xinjiang, an arid region in mid-latitude Asia. Standardized Precipitation Evapotranspiration Index (SPEI) was adopted to describe drought variation over Xinjiang during the period of 1951–2020. Teleconnection effects of El Niño Southern Oscillation (ENSO), Pacific Decadal Oscillation (PDO), Atlantic Multidecadal Oscillation (AMO), and Arctic Oscillation (AO) on Xinjiang drought variability were analyzed based on cross-correlation and stepwise regression methods. Partial correlation analysis was applied to discuss the responding mechanism of drought behavior to teleconnection signals from the perspective of regional climate factors. Findings from this study indicate that synchronous ENSO featured by Nino3.4 index has a significant positive correlation with Xinjiang dry/wet variation. El Niño may favor to wetness in Xinjiang, while La Niña may exacerbate drought effect in the region. ENSO mainly acts on the short-term drought variability in Xinjiang region. The synchronous PDO makes a leading contribution on drought variation at 12-month time scale among the four signals. The significant positive correlation between PDO and drought variation suggests that positive-phase (negative-phase) PDO may contribute to wetting (drying) epochs in Xinjiang region. AMO indicates a significant negative correlation with Xinjiang drought on both synchronous and asynchronous modes. Positive (negative) phase AMO may favor to dry (wet) effects in Xinjiang. AMO appears a predominant teleconnection effect on long-term drought variability, and fluctuates a persistent anti-phase mode with Xinjiang dry/wet variability since the mid-1980s. AO mainly acts on short-term drought fluctuations, indicating a significant negative correlation with drought behavior within a 12-month moving time window. Positive (negative) phase AO may contribute to dry (wet) epochs over Xinjiang. ENSO and PDO affect short-term dry/wet variation mainly through the teleconnection effect on precipitation variability. AMO mainly influences Xinjiang drought evolution by acting on regional temperature variation. The influence of internal atmospheric variability on regional climate behavior has a delayed effect, and drought variability is affected by precursor pattern of teleconnection likewise.
1. Introduction
Drought is a kind of climate phenomenon characterized by a shortage of water, which is insufficient to meet human survival and economic development [1]. As global warming intensifies since the late 1970s, the risk of drought increases [2]. Statistical data indicate that meteorological disasters account for approximately 70% of all natural disasters and that half of them resulted from drought [3]. Influenced by the East Asian monsoon and complex terrain [1], China is one of the most climatically fragile areas in the world [3]. China is a country with frequent and severe drought disasters [4]. Drought disaster accounts for 50% of the affected area of China’s meteorological disasters, whereas flood disaster only accounts for 27.8% [3]. There has been a general drying trend over China since the 1950s, with the most severe and prolonged droughts occurred after 1990 [1,5]. Increasing in drought intensity and frequency during the past 50 years seriously threatened agricultural production and natural ecosystems in China [6]. Agricultural areas affected by droughts in northern China were estimated to exceed 40 million hectares in 2000 [2]. The climate of china has experienced extreme drought period from 1991 to 2009 leads to loss of 17 billion Chinese Yuan and about more than 11 million peoples face shortage of drinking water and other basic needs of life [7]. Arid regions in northwestern China (where Xinjiang located) face severe drought risk and water crises [8]. The northwest region is the most prone to drought in China, and the annual losses caused by drought accounted for 4% to 6% of the GDP [9]. Drought is a key process for regional management in water-stressed regions [10]. Recent research suggests that with the further development of global warming, drought will be more severe in the future [11]. Warmer climate states appear to produce greater climate variability, which means that global warming will intensify the hydrological cycle, with wet regions becoming wetter and dry regions becoming drier [12]. This is crucial in arid regions, since the added pressure of limited water resources is further exacerbated by climate warming [13]. Global climate change has sharpened focus on the social and economic challenges associated with water deficits, particularly in regions where anthropogenic demands exceed supply [14], such as Xinjiang [5,15], an arid region in central Asia.
Understanding the dynamical causes of drought variability is of paramount importance in water-poor regions [16]. The role of natural climate variability in modulating extreme climatic events provides a key for anticipating the drought occurrence [17]. Drought is generally driven by extremes in the natural variations of climate, which are forced by internal interactions of the atmosphere and feedback from the oceans and land surface [15]. The concept that distant regions are affected by large scale changes in atmospheric circulation patterns is defined as atmospheric teleconnections [2]. Teleconnection patterns of oceanic-atmospheric oscillations and sea surface temperature (SST) provide predictive information and have been related with drought variations in regions around the world [18,19]. The primary modes of natural climate variability consist of variability in the Pacific, i.e., Pacific Decadal Oscillation (PDO) and El Niño Southern Oscillations (ENSO), and the Atlantic variability, i.e., Atlantic Multidecadal Oscillation (AMO) [20]. These oscillations have periodicities that vary from an interannual scale to decadal and multidecadal scales [18]. Meanwhile, the Arctic Oscillation (AO) is also a key aspect of climatic variability in the Northern Hemisphere [21]. Accurate attribution of drought requires accounting for natural variability, especially ENSO effects as the most common source of episodic drought around the world [10,22,23]. The alternation of warm El Niño and cold La Niña conditions refer to as the ENSO [24,25], generated by air–sea interactions in the tropical Pacific [26,27]. ENSO represents the largest natural perturbation to the global climate on an inter-annual time scale [28,29,30,31,32], affecting much of the interannual temperature and precipitation variability across the globe [33,34]. ENSO events increase the possibility of global extreme drought events, and it can change the frequency and intensity of drought [35]. Drought-related crop failures due to El Niño were a major contributor to historical famine [25]. The La Niña-like SST patterns in the tropical Pacific may cause droughts in the extra-tropics [36]. The Pacific Decadal Oscillation (PDO) characterizes low frequency changes in the North Pacific Ocean with a period of approximately 30- to 50-year [37]. The interaction between PDO and ENSO makes it necessary to study the correlation between PDO and drought [16,38]. Moreover, the PDO phase and amplitude activity play an important role in rainfall variability, however rainfall is one of the main parameters of meteorological drought [37,39,40]. The Atlantic Multidecadal Oscillation (AMO) refers to a multidecadal (50- to 70-year) time-scale signal centered in the North Atlantic, but with hemispheric-scale impacts [41]. Variations in AMO have also been regarded as an influence on past mega-droughts, especially in combination with SSTs like La Niña [16]. Linking drought characteristics and atmospheric teleconnection patterns is one of the methods to assess climate variability related drought conditions, exploiting this long-term spatial memory [42]. Drought incidences around the globe are related to large scale climate indices. However, understanding at the local scale has still been a critical issue due to the heterogeneity in spatio-temporal hydro-meteorological variability [2]. It has been documented that different responses vary from region to region, and arid regions showed stronger correlations to climate anomalies than did sub-tropic humid regions [2]. These descriptions highlight the require to evaluate the teleconnection impacts of ocean-atmospheric oscillations on drought over Xinjiang, where is one of the most drought-affected regions in the world [43,44].
Drought is a state of surface water imbalance in which water supply cannot satisfy normal water demand [35]. Droughts are generally classified into four categories: (i) meteorological drought; (ii) hydrological drought; (iii) agricultural drought; (iv) socio-economic drought. Meteorological drought is defined as a lack of precipitation over a region for a period of time. Agricultural drought usually refers to a period with declining soil moisture and consequent crop failure. Hydrological drought develops on seasonal to interannual time horizons by depleting streamflow or reservoir levels. Socioeconomic drought is associated with failure of water resources systems to meet water demands [2,11,23]. The complex nature and widespread impacts of drought make it difficult to measure drought events qualitatively and quantitatively [3]. In this regard, a time series of drought indices provides a framework for evaluating drought parameters of interest [2]. The Standardized Precipitation Index (SPI) is designed to track precipitation deficits and surpluses across multiple time scales, making it ideal for differentiating between different types of drought [11]. However, the exclusion of temperature in SPI limits its effectiveness for some applications and research questions [11,23,45]. In the context of global change, rising temperature has become one of the important factors aggravating drought processes [1,3,46]. The objective characterization of drought conditions requires us to consider the joint effects of precipitation and temperature changes. The Palmer drought severity index (PDSI) is a classical index in meteorological drought monitoring incorporated the temperature and evapotranspiration (ET) [35]. Due to the complexity of calculation and the high amount of required data, some parameters can only be estimated by experience, resulting in a great reduction in the calculation accuracy [1]. Recently, Vicente-Serrano et al. (2010) [47] proposed a new meteorological drought index, the Standardized Precipitation Evapotranspiration Index (SPEI) based on SPI. Since it takes into account both precipitation and temperature and integrates the advantages of the PDSI (i.e., its sensitivity to temperature changes) and the SPI (i.e., its simple calculation process and property of multiple timescales), the SPEI has become one of the most useful indices for monitoring drought processes under global warming [1,3]. The SPEI depend on simplified estimates of potential evapotranspiration (PET) that must be parameterized [11]. The two most widely used equations for PET calculation are Thornthwaite and Penman–Monteith [45]. The physically based Penman–Montieth equation requires temperature, humidity, surface pressure, net radiation, and wind speed data, however among which, only temperature is widely available across large spatial scales and going back more than a few decades [11]. Hence, the Thornthwaite model based on temperature has been widely utilized [10,45,48,49].
This study aims to explore the climate drivers of Xinjiang drought from the perspective of internal atmospheric variability. Four large-scale modes are inspected: (1) the Nino3.4 index to denote the temperature fluctuations of Pacific Ocean, i.e., ENSO; (2) the PDO index to denote the first principal component of north Pacific SST anomalies; (3) the AMO index to represent the multidecadal temperature oscillation of the Atlantic Ocean; and (4) AO index as the sign of general circulation of atmosphere and mass distribution between polar and mid-latitudes of northern hemisphere. The main objectives of this study are: (1) to explore the teleconnection effects of ocean-atmospheric oscillations on drought events in Xinjiang, an arid region in mid-latitudes; (2) to analyze the drought behavior in Xinjiang associated with large-scale climate modes; and (3) to reveal the teleconnection mechanisms of drought evolution from the perspective of regional-scale climate parameters.
2. Study Area and Data Sources
2.1. Study Domain and Its Drought Status
2.1.1. Study Domain
The Xinjiang Uygur Autonomous Region (Xinjiang; Figure 1), a typical arid and semi-arid region, is located in the hinterland of Eurasia and northwestern China [1,50]. Xinjiang is the largest administrative region in China [51], and taking up roughly one sixth of the total area of the country [52]. Geographically, it spans the region from 34.25° to 48.10° N Latitude and 73.40° to 96.18° E Longitude, regarding an area of 1.66 million km2 across the province level [8,21,34]. Due to the special topographical features of three mountains and two basins and the unique natural environment pattern [34], it has a unique landscape that features expansive but fragile mountain-oasis-desert ecosystems [22]. Complex topographic components including desert, forest, farmland, grassland and mountain glaciers [43]. The province is primarily characterized by desert and grasslands [53], and contains three mountain ranges, i.e., the Tianshan, Altai, and Kunlun Mountains, which are surrounded by vast desert namely Junggar and Tarim basins [7,8,51]. Tianshan Mountains separate Xinjiang into northern and southern Xinjiang [54], resulting in mountain-basin systems with different hydrological conditions [8]. The majority of northern Xinjiang is covered by arid and semi-arid drylands, while much of southern Xinjiang is much drier than its northern counterpart (arid and hyper-arid types) [44]. The barrier of high mountains makes it difficult for the sea currents to reach to the area, and the widely developed inland rivers became the unique mountain-oasis-desert system [1]. The average annual precipitation in Xinjiang is only 147 mm, whereas the mean annual potential evaporation is 1512 mm in the region [52,54]. The average annual temperature is around 9.2 °C [1]. Since the wet marine air rarely reaches inland [9], making it one of the driest areas in the world [8]. This region experiences unique water cycle caused by the dry climate [51]. The subsurface of the Gobi Desert responds quickly to solar heating, resulting in major evaporation of ground moisture and thus increased drying [10]. Owing to the lack of rainfall in the areas, it is characterized by the scarcity of water resource, with drought occurred frequently [55]. It has been documented that there were 17 severe drought disasters and 9 major droughts in Xinjiang over the period of 1961–2000 [54]. Due to the extremely dry climate, the region sensitively respond to climate change [43,56,57]. The fragile ecological environment, unique water cycle, and extreme sensitivity to climate change make it a typical arid area and a key region for global climate change research [50].
2.1.2. Drought Status
As a main part of arid Central Asia, Xinjiang is facing a series of environmental problems related to global climate [58]. The combined effect of precipitation and temperature anomalies determines the dry/wet variation in a region [59]. Numerous studies reported that the climate in Xinjiang has transformed from warm-dry to warm-wet trends over recent decades [10,21,52,56,58,60,61,62]. Air temperature also experienced a sharp increase (after the year 1997) in association with global warming, and then has been in a state of high volatility [22,58,63]. Dramatic changes in climatic conditions can bring about adverse effects, and drought is one of them [10]. Recent researches have documented sharp changes in Xinjiang climate occurred in 1997 [1,7,8,10,22,50,64], indicating that 1997 is considered the inflection point of climate change in Xinjiang, with the frequency of drought increased sharply hereafter [10]. As stated by Yao et al. [8], Xinjiang has been experiencing increased drought severity since 1997 as a consequence of a significant increase in temperature coupled with an insignificant increase in precipitation. To this regard, the apparent paradox of increased drought risk in a wetter climate is easy to reconcile: the increase in demand for evaporation from higher temperatures exceeds the increase in supply from precipitation [11]. In the case that both precipitation and temperature may increase in the future, the increase in evapotranspiration caused by temperature rise will greatly affect drought dynamics [4]. Drought severity will likely continue to increase in arid and semiarid regions in the future as global warming continues [8,59]. These descriptions emphasize the aggravation in drought states and the necessity of drought research over Xinjiang region.
In order to confirm this, we compared the drought conditions in Xinjiang with the baseline state of China, the mean SPEI time series of two domains during January 1997 to December 2021 were visualized based on 13 meteorological stations in Xinjiang region and 160 meteorological stations throughout China (Figure 2). Precipitation and temperature data were provided by National Climate Center, China Meteorological Administration (Accessed on 12 January 2022). The SPEI were calculated on time scales of 1- to 24-month windows. The most commonly used time scale for drought analysis is a year (i.e., SPEI-12), which can be used to abstract information on the regional behavior of droughts [2].
Figure 2 provides the latest meteorological drought records for Xinjiang and China. Drought states in Xinjiang appear to be more severe in recent decades than the mean baseline in the Chinese territory, in particular, 2008–2009/10 and 2012 to date. Figure 2 shows the fluctuating pattern of dryness (rather than wetting) averaged over China since 1997, one can see that droughts in Xinjiang region have been stronger than the changing mode averaged in Chinese territory during the last decade (2012–2021), especially the long-term droughts. Hence, it is reasonable to suggest that the drought dynamics in Xinjiang are more dramatic than in other parts of China since the last decade.
2.2. Data Sources
2.2.1. Meteorological Datasets
The reliable results of climate change depend on accurate data record at different meteorological stations. The length of time series, reliability and continuity are important aspects of climate research [7]. The current study mainly focused on two major parameters of climate change, i.e., precipitation and air temperature. The monthly precipitation and temperature data of 13 meteorological observation stations in Xinjiang were used for this study. The geographical location of the meteorological stations is shown in Figure 1. The data of selected stations were obtained from the National Climate Center of the China Meteorological Administration (http://cmdp.ncc-cma.net/cn/download.htm, accessed on 21 October 2021). Meteorological data for study purpose cover the period of January 1951 to December 2020, spanning the time up to 70 years. All gauging stations have continuous records with no missing values over the last seven decades. Data quality control and the calculation process were performed in strict accordance with the study requirements. Quality and homogeneity control were checked by using the Pettitt test [65], standard normal homogeneity test [66], and Buishand’s test method [67]. Based on this, the SPEI time series were established on the scales of 1 to 48 months with a time span of 1951–2020 to characterize the long-term drought pattern in Xinjiang so as to analyze its potential climatic drive factors. As it has multiple timescales and is sensitive to temperature variations, the SPEI is of great advantage to be used for dry-wet analysis with global warming as the background [50].
2.2.2. Large-Scale Ocean Atmosphere Circulation Modes
Extreme climatic events such as droughts are generally attributed to unique atmospheric circulation patterns in connection with climate change [68,69]. Xinjiang is located in the westerly-dominated climatic regime, and the precipitation is impacted by the mid-latitude atmospheric circulation and AMO [64], and the drought variability was closely related to AMO and ENSO events [10]. Correlations between ocean-atmospheric signals, i.e., ENSO, PDO, AMO, AO, and drought behavior in Xinjiang were analyzed in the current study. ENSO is a natural ocean-atmospheric interaction process defined by SST variations measured in the central and eastern equatorial Pacific [70]. The Nino3.4 index was used to characterize the ENSO phenomenon in this study. The mean SST anomaly in the tropical Pacific region (5° N to 5° S, 170° W to 120° W) refers to Nino3.4, which normally corresponds to hydrological variations all over the world [10,69]. PDO is an index of the SST variations in the Pacific Ocean poleward of 20° North. Unlike to a cycle of 3- to 7-year in ENSO, PDO has a low frequency with a cycle of 5- to 30-year [70]. AMO represents the mean SST changes over the North Atlantic Ocean from 0° to 60° N, characterized by multidecadal variability of 40- to 70-year [10]. The AMO index is a measure of the 10-year running average of SST anomalies in the North Atlantic Ocean [70]. AO is the time coefficient of the first mode of the empirical orthogonal function analysis of the sea level pressure anomaly outside the tropical northern hemisphere [71]. The AO index is obtained by projecting the AO loading pattern to the daily anomaly 1000 millibar height field over 20° N to 90° N latitude [69]. Monthly time series during January 1951 to December 2020 of Nino3.4, PDO, AMO, and AO indices (shown in Figure 3) were derived from the Physical Sciences Laboratory, National Oceanic and Atmospheric Administration (NOAA) (Accessed on 29 Novermber 2021).
3. Methodology
3.1. Standardized Precipitation Evapotranspiration Index (SPEI)
SPEI is estimated by the climatic balance between precipitation and atmospheric evaporative demand (potential evapotranspiration, or PET), which has become effective index to monitor and assess droughts under global warming [10]. The SPEI allows determination of drought severity at different time-scales, which is essential for assessment of the different responses to drought in climatic and hydrological systems [72]. Time scales of 1 to 48 months are utilized in the current study to describe the temporal evolution of Xinjiang drought. Firstly, the Thornthwaite model [73] was employed to calculate the potential evapotranspiration, which is correlated with monthly mean temperature. Then, the difference between monthly precipitation and potential evapotranspiration was calculated to determine the sequence of accumulation of water surplus or deficit at different time scales. Finally, the water balance was normalized into probability distribution to obtain the SPEI series. As the negative values may be in the original data sequence, the SPEI index was calculated using the three-parameter log-logistic probability distribution to standardize the cumulative probability density [1,8,62]. The specific calculate process of the SPEI is as follows.
Calculating the monthly potential evapotranspiration (PET) by using the Thornthwaite method:
where N is maximum number of sun hours, is number of days in the month, T is mean air temperature (°C), and I is heat index, which is calculated as the sum of 12 monthly index values:
and m is a coefficient that depends on I:
The calculated values are aggregated into different time series, following the same procedure as for SPI. The difference in a given time n depends on the chosen time scale k (months):
Next, the water balance is normalized into a log-logistic probability distribution to obtain the SPEI index series. The probability density function of a three-parameter log-logistic distributed variable can be expressed as follows:
where , , and denote the scale, shape, and origin parameters for D values in the range , respectively. The calculation process of each parameter is as follows:
where is the gamma function of , and is the probability-weighted moments (PWMs) of order s for D data series:
where n is the number of data points, and j is the range of observations in increasing order.
Thus, the probability distribution function of the D series is given by:
Ultimately, the F(x) value is transformed to a normal variable by means of the following approximation, and the SPEI can be calculated.
where, the constants are as follows [47]:
Positive SPEI indicates wet condition and negative SPEI signifies dry condition [45].
3.2. Pearson Correlation
As a mathematical approach that widely used in the climatic analyzes, correlation is statistical indicator that describes the relationship between two or more variables indicated by the correlation coefficient [74]. The Pearson product-moment correlation coefficient (PPMCC) was calculated to investigate the simultaneous dependence between the drought indices and oceanic atmospheric circulation series on different time scales. The climatic indices were smoothed for the same scale (moving averages) to be comparable with the results of the SPEI. The significance of the correlations was tested with Student’s t-test and considering the confidence level of 95%. The sample correlation coefficient, r, between two variables X and Y is given as [75]:
where and represent the SPEI and ocean-atmospheric circulation indices, respectively, i denotes the data number, and represent the average of and . The value of r lies in the range of −1 to 1. r > 0 means positive correlation and r < 0 means negative correlation [76].
3.3. Cross Correlation
Cross-correlation investigates the similarity between two variables as a function of lag time. In this method, the correlation function shows the correlation of variables with the previously occurring variables [77]. One of the most important advantages of the cross-correlation method, compared to the simple correlation, is the possibility of determining the correlation coefficient in different lags, including the positive and negative lags [78]. Cross-correlation analysis was used to analyze the lag effect of ocean-atmospheric oscillations patterns on drought indices. The cross correlation function (CCF) coefficient was utilized to investigate the asynchronous relationships at lag time of 1 to 48 months. The CCF can be formulated as follows:
where, the covariance and mean square deviation and of the sample are expressed as follow, respectively:
where the mean value is:
where, n is the number of sample sequences and , and k denotes the time lag with a unit of month. As a rule of thumb, the absolute value of the time delay k should be less than n/4 [71].
3.4. Stepwise Multiple Regression
Stepwise regression is generally employed to determine governing factors from a larger number of variables involved, and also provides the significance of the determined variables [79]. In this method, the most influential variables were entered one by one until the experimental error reached 5% [78]. The stepwise multivariate regression was utilized to predict the simultaneous and time lag effects of ocean-atmospheric indices on SPEI. The regression equation can be expressed as follows:
where denotes the constant of regression model, denotes the ocean-atmospheric index, denotes the coefficient of ith index in the regression model, and p is the number of determined indices. Based on the regression results, the explained variance of variables can be represented by the R-square. The R-square of stepwise 1 is the explained variance of the first variable entered, and the difference of the R-square between stepwise 1 and stepwise 2 is the explained variance of the second variable entered and the behind variable, etc. [15].
3.5. Partial Correlation
Partial correlation analysis is linear correlation method to eliminate the influence of a third variable on the correlation between any two variables [80]. To exclude ocean-atmospheric oscillations patterns influence single climate element, partial correlation analysis is applied in this study, in order to achieve the alone relationship between climate indices and the SPEI removed precipitation or temperature variations from it.
where, Y, B, and A indicate climate indices (Nino3.4, PDO, AMO, and AO), SPEI, and precipitation/temperature series, respectively, so as to obtain the pure correlation between climate indices and SPEI excluded the effects on precipitation/temperature. R denotes the correlation coefficient, and denotes the partial correlation coefficient between climate indices and SPEI, after removing the effects on precipitation/temperature (single meteorological factor) [81]. Our objective is to isolate the independent effects of ocean-atmospheric oscillations on precipitation or temperature among drought behavior.
4. Results
4.1. Long-Term Modes of Both Teleconnections and Climatic Parameters
To visually show the long-term patterns of ocean-atmospheric interaction and regional climate factors, year-month matrix maps of time series over the last seven decades (1951–2020) was drawn in Figure 4. Deviation of rainfall/temperature from the long-term normal is a preliminary indicator of rainfall/temperature variability in the region [70]. The residual map indicates the difference between the recorded monthly total rainfall (monthly mean temperature) and respective long-term mean monthly value. The residual embodies the monthly wetness and surface temperature as compared to the long-term means of the respective corresponding month.
The lack of coincidence relation between regional climate parameters and NINO3.4 mode (Figure 4a,e,f) indicates that variations in local rainfall and air temperature may be explained by the cumulative effect of other climatic drivers and external factors. Likewise, the precipitation and temperature deviations in this region have less correspondence with the low frequency PDO index (Figure 4b,e,f). This plot shows a coincidence between the temperature variability in Xinjiang and the AMO temporal mode (Figure 4c,e,f). On the interdecadal time scale, precipitation and temperature residuals have high similarity with AMO (Figure 4c,e,f). For instance, low rainfall and low temperature periods in the 1970s and 1980s corresponded to negative AMO phases. The long term high rainfall and high temperature in the late 1990s corresponded to the positive AMO phases. However, the positive phase of AMO prior to the 1960s (after 1950s) did not show similarity to the variability of local climatic factors. Given the high-frequency AO variability, its incapable to determine the corresponding relationship with regional climate parameters (Figure 4d,e,f).
4.2. Spatial Pattern for Synchronous Correlation
Drought is quantified using the Standard Precipitation Evapotranspiration Index (SPEI). The interannual variation of SPEI at different time scales (1- to 48-month) over Xinjiang during 1951–2020 is shown in Figure 5a. The time series of SPEI-6, SPEI-12 and SPEI-24 are shown in Figure 5b–d. The short-term timescale SPEI indicates an evident cyclic mode of wet/dry fluctuation during 1950 to the late 1990s. However, extremely droughts occurred from 1960 to 1970, from mid 1970s to mid 1980s, and from late 1990s to present in Xinjiang region. Xinjiang has been in a phase of fluctuating extremely droughts since the late 1990s.
To attribute the apparent increase in the regional drought occurrence to climate variability, we investigated the impact of the large-scale atmospheric circulation patterns, i.e., ENSO, PDO, AMO, and AO. For the sake of understanding teleconnections between meteorological and long-term droughts with climatic indices, the simultaneous dependence between the SPEI and climate indices in 3-, 6-, 12-, 24-, 36-, and 48-month time windows was examined based on Pearson correlation approach. The spatial patterns of correlation coefficient was explained based on the Kriging interpolation technique that in the GIS environment, with the results shown in Figure 6.
The correlation between teleconnection indices and SPEI has spatial heterogeneity (Figure 6). Overall, the correlation between SPEI and climate indices vary with the time scales, with the longer the time windows of SPEI, the stronger its correlation with climate indices. On the intra-annual time scale (SPEI-3, SPEI-6, SPEI-12), the spatial correlation between SPEI and NINO3.4 indicates a positive correlation around northern Xinjiang and Tianshan Mountains. The SPEI in northwest Xinjiang is positively correlated with PDO index, that is, the positive phase of PDO corresponds to the wet period in the area. Similarly, the spatial modes of the correlation between Xinjiang SPEI and AMO is positive in the northwestern part while negative in the southeastern part, with the correlation highest among the four teleconnection indices. The positive (negative) AMO phase corresponds to the wet period (dry period) in northwest Xinjiang and the dry period (wet period) in southeast Xinjiang. The correlation between SPEI and AMO is homogeneous in temporal and spatial modes (scales). By contrast, the correlation between drought condition and AO index was instability, with the longer the time scale in SPEI, the more concentrated its correlation with AO in space. The semblable spatial pattern can be seen in the correlation with ENSO.
4.3. Asynchronous Correlation on Different Timescales
The relationship between ocean-atmospheric oscillation indices and drought was analyzed using simultaneous and asynchronous correlation analyses. The former procedure evaluates the impact of oscillations on drought during a certain period, while the latter investigates the time lag effect of ocean-atmospheric oscillations on drought on monthly timescales [77]. In the asynchronous correlation analysis, i.e., cross-correlation analysis, the asynchronous relationship refers to the monthly difference between ocean-atmospheric anomalies and drought occurrence. The advantage of using cross-correlation, compared to such correlation coefficients as the Pearson correlation, is that it can detect the best time-lag for climate signals that relate to SPEI, which is useful in developing the stepwise regression model [78]. In this regard, the cross-correlation coefficient between the SPEI time series for a specified time (t) and climate signals for the (t–k) period were calculated to obtain the correlation between climate indices and the SPEI with k-month lag. At that point, the relationship among teleconnection indices and Xinjiang drought were investigated. Figure 7 shows the cross-correlation coefficient between SPEI and climate indices on different time scale, with taking into consideration both the time-lead and delay for 48-month.
The color separation boundary of each sub-color band in Figure 7 indicates the correlation coefficient is 0, and the darker the color denotes the stronger the correlation. On the relationship between SPEI and NINO3.4, the simultaneous correlation is positive phase at both 0- to 48-month time windows (Figure 7a). The positive correlation between the two intends to convert to negative correlation along with leading and lagging SPEI. The simultaneous dependence between SPEI and PDO shows positive phase in 0–48 months time windows. The difference with ENSO is that the positive correlation between SPEI and PDO is dominant in the time-delay period less than 48 months. This may be relevant to the low frequency variability of PDO climatic signal [37]. In addition, the correlation coefficient of asynchronous relationship is lower than that of simultaneous relationship. The correlation coefficient decreases with leading/lagging SPEI. Different from other teleconnection signals, both synchronous and asynchronous correlations of SPEI and AMO are negative phase over 0–48-month time windows (Figure 7c). Hence, the positive (negative) phase AMO may contribute to the dryness (wetness) in Xinjiang. By contrast, the correlation between SPEI and AO is unstable within 0–48-month lead and lag phases (Figure 7d). This may be associated with the long-held high volatility of AO index (Figure 4d). The synchronous correlation between SPEI and AO shows mainly negative phase. With the lead and time-delay of SPEI, the negative correlation between SPEI and AO index tends to positive phase. When the lag period of SPEI exceeds 12 months, the positive phase is predominant on the asynchronous relationship between SPEI and AO. Within the time window of 0–12 months, there is a hot spot with the SPEI lead/lag time being less than 3 months, indicating that SPEI has the strongest negative correlation with AO index (Figure 7d).
The lead/lag correlations between teleconnection indices and SPEI12 are shown in Figure 8. SPEI12 can embody the interannual variation of drought conditions in Xinjiang. The correlation coefficients between teleconnection indices and SPEI12 indicate some of the aforementioned results more visually. For synchronous correlation (lead/lag month = 0), SPEI12 has significant positive correlation with ENSO and PDO indices, and the correlation with PDO is higher than that with ENSO (CENSO = 0.138; CPDO = 0.314). While SPEI12 has significant negative correlation with AMO and AO indices, and the correlation with AMO is higher than that with AO (CAMO = −0.258; CAO = −0.215). When SPEI12 lags ENSO variation by approximately 12 months, the negative correlation between the two reaches to the maximum value of around −0.13 (Figure 8b). The correlation between synchronous PDO and SPEI12 was higher than asynchronous PDO, showing a significant positive correlation with a correlation coefficient of around 0.32 (Figure 8c). Within the 48-month lead and lag period, the correlation of AMO and SPEI12 indicates persistent negative phase, with correlation coefficient of approximately −0.30 (Figure 8d). The correlation between AO and SPEI12 varies by different lagging time (Figure 8e). The significant negative correlation between synchronous AO and SPEI12 rapidly converts to positive correlation within the 12-month time lag, and reaches a maximum positive correlation at the 18-month time lag with a correlation coefficient of approximately 0.20.
Furthermore, correlation coefficients of the SPEI and climate indices on 3-, 6-, 12-, 24-, 36, and 48-month time windows are shown in Figure 9, with time-delay in SPEI being 0- to 24-month. Figure 9a shows the transition from positive correlation to negative correlation for SPEI and ENSO on intraannual (SPEI-3, SPEI-6, SPEI-12) and interannual scales (SPEI-24, SPEI-36). The correlation between SPEI and PDO is similar to that of ENSO (Figure 9a,b). However, SPEI has more intense correlation with PDO than ENSO, which shows significant positive correlation on interannual time scales (SPEI-24, SPEI-36, SPEI-48) (Figure 9a,b). The correlation coefficient between SPEI and PDO decreases with the extension of lag time, which is similar to the ENSO mode (Figure 9a,b). Figure 9c again illustrates the consistent negative correlation between SPEI and AMO. The correlation between AMO and SPEI on interannual scale (SPEI-24, SPEI-36, SPEI-48) is stronger than that on intraannual scale (SPEI-3, SPEI-6, SPEI-12). The correlation between SPEI and AO index on intraannual scale (SPEI-3, SPEI-6, SPEI-12) converts from negative phase to positive phase (Figure 9d), which is in contrast to the ENSO and PDO (Figure 9a,b). On interannual scale (SPEI-24, SPEI-36, SPEI-48), the asynchronous relationship between the two is predominated by positive phase.
At that point, it can be concluded that Xinjiang SPEI has the weakest correlation with ENSO (represented by NINO3.4 index) among the four climate indices, and the phase relationship is unstable. The correlation between SPEI and PDO in Xinjiang is dominated by positive phase, and the correlation decreases with the extension of lag time. Positive-phase PDO may contribute to the wetness in Xinjiang, while negative-phase PDO may be conductive to the dryness in the region. Both synchronous and asynchronous relationships for SPEI and AMO are significant negative correlation, which is higher on interannual scale. Positive-phase (negative-phase) AMO may correspond to the dry epoch (wet epoch) over Xinjiang. The synchronous relation between SPEI and AO is predominated by significant negative correlation, while the asynchronous relation is dominated by positive phase. On the phase of intraannual time scale (SPEI-3, SPEI-6, SPEI-12) with a lag of less than 6 months, the negative correlation is maximum between SPEI and AO. However on interannual time scales (SPEI-24, SPEI-36, SPEI-48), the longer the time-delay, the stronger the positive correlation.
4.4. Combined Effects of Climate Modes on Regional Droughts Variability
The stepwise regression models of SPEI with time windows of 3-, 6-, 12-, 24-, 36- and 48-month were established based on ENSO(NINO3.4), PDO, AMO and AO indices series. In stepwise regression analysis, the selected variables were entered one by one. This continued until the model error reached below 5%, which resulted in the inclusion of only the most important variables; less important variables were excluded from the model [78]. The moving average approach was used to obtain the teleconnection series with comparable time scale with SPEI. The results of stepwise regression are shown in Table 1.
The individual and combined effects of climate patterns on Xinjiang drought were assessed by using stepwise regression analysis at different time scales (Table 1). Drought variability evaluated based SPEI-3 and SPEI-6 denote the seasonal fluctuation, and negative (positive) values of the SPEI-12 refer to the presence of annual sustained dryness (wetness) [70]. SPEI-24, SPEI-36 and SPEI-48 represent long-term drought variability that on interannual scales, such as hydrologic drought. A p-value less than 0.025 in Table 1 indicates a statistically significant correlation between the teleconnection index and SPEI. The teleconnection firstly selected in stepwise regression model indicates the index with the highest interpretability for drought variability on the corresponding time scale (Table 1). Stepwise regression analysis suggests that AO index has the highest explanatory degree for seasonal drought fluctuation (SPEI-3, SPEI-6) with a significant negative correlation. PDO explained the highest degree of interannual drought variability (SPEI-12) in Xinjiang with a significant positive correlation between the two. Among the four teleconnection indices, AMO dominates the interpretability on interannual-scale drought variability (SPEI-24, SPEI-36, SPEI-48), showing a significant negative correlation. However, the explanation degree of ENSO on Xinjiang drought is relatively low, which is consistent with the preceding result (Figure 9a). The AMO signal has a strong association with SPEI on both intraannual and interannual scales (Table 1). Hence, the signature of AMO fluctuation in regional drought variability is more significant as compared to other teleconnection indices.
Based on the results of synchronous and asynchronous correlation, the optimal lag time of teleconnection signals associated with SPEI was detected in 3-, 6-, 12-, 24-, 36-, and 48-month time windows. Stepwise regression models for SPEI-3, SPEI-6, SPEI-12, SPEI-24, SPEI-36 and SPEI-48 were established based on the optimal correlation (synchronous or time-delay) series of climate signals. The results of stepwise regression analysis and the optimal time-delay of teleconnection related to SPEI in different time windows are shown in Table 2. Among which, lag k means that SPEI lags the climate index by k months.
Stepwise regression analysis based on optimal time-delay indicates that the AMO series with a lag of 17 months has the highest explanatory effect on seasonal drought fluctuations (SPEI-3, SPEI-6). For the drought variability on annual scale, the PDO index synchronized with SPEI-12 explained the highest degree (Table 1, Figure 8a). The synchronous correlation between PDO and SPEI is higher than asynchronous correlation, consisted with the previous analysis (Figure 7b and Figure 9b). On the interannual time scale, the AMO series synchronized with SPEI-24, SPEI-36 and SPEI-48 have the highest explanatory degree. Hence, the low-frequency AMO signal (Figure 3c) makes a dominant contribution in the interannual variability of Xinjiang drought among the four climate patterns. Among the four teleconnection factors, synchronous PDO signal plays a dominant role in the annual drought fluctuation in Xinjiang, while AMO variability is an important driving factor of long-term drought variability in the region.
Based on cross-correlation analysis, the in-phase fluctuation mode of SPEI12 with ENSO(NINO3.4) and PDO index was determined (Figure 8). On the basis of annual scale, the significant positive correlation between synchronous NINO3.4 and SPEI12 indicates that El Niño may correspond to the wet epoch (SPEI+) in Xinjiang, while La Niña may correspond to the dry epoch (SPEI−) in the area. Similarly, positive anomaly PDO may correspond to the wetness (SPEI+), whereas negative anomaly PDO may correspond to the drought (SPEI−). Considering the important role of ENSO and PDO on annual drought variability (correlation with SPEI-12 in Figure 8), combined with the superimposed effect of PDO on ENSO [25], the monthly SPEI12, NINO3.4 and PDO index series were drawn as shown in Figure 10.
During 1998 to 2003, La Niña events (ENSO−) corresponds to drought epochs (SPEI12−) over Xinjiang (Figure 10a,b). During the period of 1985–1991, the PDO+ signals corresponds with the wet phase (SPEI12+) in Xinjiang (Figure 10a,c). The PDO continued to be in positive phase during 1991–1998, when El Niño events (ENSO+) occurred, which may play a constructive role in annual-scale dry/wet variability (SPEI12+). Xinjiang has been in a persistent drought state from 2007 to 2014, which may be related to the superimposed effect of ENSO− (La Niña) and PDO− in this period (Figure 10a–c).
According to cross-correlation analysis, the anti-phase fluctuation mode of SPEI with AMO and AO indices in Xinjiang was discussed (Figure 7c,d and Figure 9c,d). The SPEI-24 was utilized to describe long-term variation of Xinjiang drought, i.e., hydrological drought. The significant negative correlation between AMO and SPEI indicates that AMO+ may correspond to drought epoch (SPEI−), and AMO− may correspond to wet epoch (SPEI+). Likewise, positive anomaly AO may favor to dryness (SPEI−), while negative anomaly AO may contribute to wetness (SPEI+). Given the low-frequency variability of AMO (Figure 3c), the monthly series of SPEI-24, AMO and AO index were plotted, as shown in Figure 11.
Figure 11 shows an evident correspondence between drought and AMO variability on the interannual scale. SPEI-24 and AMO fluctuated persistently anti-phase during 1984 to 2018. The anti-phase pattern of the two continues from 2018 to 2020. However, the corresponding relationship between SPEI-24 and AMO is weak during the 1950s to the mid-1980s, only showing an anti-phase pattern from 1968 to 1976 (SPEI24+ and AMO−). During 1984 to 1997, the negative anomaly of AMO corresponds to the positive phase (wet period) of Xinjiang SPEI-24. The negative phase of Xinjiang SPEI-24 (dry period) corresponds with the positive anomaly AMO during 1997 to 2020. The results indicate that the positive phase AMO signal from 1997 may contribute highly to the long-term drought pattern in Xinjiang. By contrast, the corresponding relation between AO index and SPEI-24 is relatively weak, indicating that AO has less effect on the interannual variation of Xinjiang drought, which is consistent with the previous results (Figure 7d and Figure 9d).
4.5. Influences of Teleconnections on Single Climatic Factor
Based on the 0–48-month time windows SPEI and series of contemporaneous teleconnections, partial correlation analysis was applied to isolate the mechanism of teleconnections on drought conditions in Xinjiang from the perspective of regional climate variables (precipitation and temperature) over the last seven decades. Our aim is to analyze through which climatic parameter (precipitation or temperature) that the teleconnection modes mainly influence the drought behavior in Xinjiang region. Given the significant annual periodicity of the regional climate factors, the original month-by-month series subtracts by the long-term average of the corresponding month to obtain the deviation series of precipitation and temperature (shown in Figure 4e,f). The Pearson correlation coefficients between the teleconnection indices and regional climate variables (described by deviations from long-term monthly mean) were calculated on the 0- to 48-month time scale as shown in Figure 12.
Climate series on o- to 48-month time windows document the climatic variability from seasonal to annual to interannual scales. Overall, the correlations between teleconnection indices and regional climate factors increase with increasing time scales (Figure 12). ENSO, PDO and AMO indices are all positively correlated with precipitation in Xinjiang (Figure 12a). The correlation of ENSO and PDO with regional precipitation tends to be stable as time scales increasing, with the positive correlations indicating significant on the interannual time scale. On 12–48-month time scales, the correlation coefficient between ENSO and precipitation is approximately 0.22–0.26, and that of PDO approximately 0.35–0.39. The PDO index is more strongly correlated with precipitation variability compared to ENSO. The correlation of AMO with Xinjiang precipitation is the highest among four teleconnection indices, reaching up to 0.64 on 48-month time scale with a significant positive correlation. The AO index is negatively correlated with precipitation on 0–23 months time scale, while it showed a positive correlation on a longer time scale (24–48 months). The correlation between AO signal and regional precipitation appears an inflection point at 6-month moving window, showing a significant negative correlation between the two with a correlation coefficient of −0.19.
In terms of of regional temperature, all teleconnections indicate positive correlation with Xinjiang temperature variation (Figure 12b). The correlation of ENSO and PDO with temperature on different time scales has a similarity. The correlation coefficient between AMO and temperature is the highest among the four climate patterns, reaching up to 0.60 on 48-month time scale, with a significant positive correlation on both 0- to 48-month time windows. Unlike with precipitation, AO is positively correlated with temperature on 0–48 months time scales, and correlation increases shapely on intra-seasonal scale time-window. The correlation between AO and temperature stabilizes and reaches approximately 0.37 on time scales ranging from 6 to to 12-month.
Based on the SPEI time series with 0–48 months time windows, the teleconnection effects of drought events in Xinjiang were isolated from the perspective of regional climate factors by using partial correlation analysis. The results of the partial correlation analysis are shown in Figure 13. Among which, the white dotes indicate the correlation between SPEI and climate modes in the absence of external effects. The blue (red) dots indicate the correlation between the SPEI and climate patterns when precipitation (temperature) is constant.
The results of partial correlation analysis indicate the similarity of influencing mechanisms of ENSO and PDO signals on drought in Xinjiang (Figure 13a,b). The (positive) correlation of ENSO and PDO indices with SPEI with unchanging precipitation is lower than the (positive) correlation in the absence of external influences. Hence, ENSO and PDO have certain influence on precipitation variability in the area, mainly on intraannual to short interannual scales (less than 48-month moving time window). The (positive) correlation between ENSO and PDO signals and Xinjiang SPEI increases significantly with unchanging temperature. On intraannual to interannual scales, there is no “intermediate” role of temperature in the correlation of drought variability with ENSO and PDO in Xinjiang. The partial correlation analysis indicates that the teleconnection effects of ENSO and PDO on Xinjiang drought on seasonal to shorter interannual scales are mainly reflected through the significant positive correlation with precipitation fluctuations.
The correlation between AMO and SPEI shows an opposite pattern (Figure 13c). The (negative) correlation between AMO and Xinjiang SPEI is significantly enhanced when precipitation is constant. Therefore, there is no teleconnection effect on precipitation in the association of AMO signal with drought events in Xinjiang. However, the correlation between AMO and SPEI with unchanging temperature is significantly lower than the correlation without external effects. The results indicate that the negative correlation effect of the low-frequency AMO signal on drought conditions in the region is mainly reflected by the significant positive correlation with regional temperature (Figure 12b and Figure 13c). On intraannual to interannual time scales, AMO affects drought fluctuations in Xinjiang by influencing temperature variability.
The correlation between SPEI and AO signal in the 0–12 months time windows indicates that AO has certain but limited effect on intra-annual scale precipitation variations (Figure 13d). On interannual time scale, there is no “mediating” role of regional precipitation in the negative correlation between the AO signal and drought variability in Xinjiang. However, the correlation between AO and SPEI with unchanging temperature suggests mainly positive correlation on interannual scales, and the correlation increased with increasing time scale. The result suggests that regional temperature plays an intense “mediating” role in teleconnection effect of AO signal on long-term drought variability in Xinjiang (Figure 13d).
5. Discussion
Drought variations are widely influenced by processes internal to the atmosphere [16]. The link between ocean-atmospheric oscillations and drought offers valuable information for analysis and prediction of drought disasters [77]. ENSO is the most prominent pattern of inter-annual climate variability [29]. Previous study indicated that regional short-term rainfall variability is associated with ENSO fluctuation, and the short-term effect of ENSO can trigger droughts or flooding [70]. The dry and wet variations are strongly correlated to ENSO in central Asia, with a maximum correlation when drought variations lags 1-year by ENSO [19], which is consistent with the results of this study (Figure 8b). Research have reported that drought epochs in Xinjiang were caused by the negative SST anomaly associated with Niño3.4 during 1997–2015 with delayed effects [10]. Findings from this study suggest that synchronous El Niño (positive SST anomaly) favors wetness in Xinjiang, while La Niña (negative SST anomaly) contributes to drought in the region. Large amount of water vapour from the North Atlantic Ocean and Indian Ocean to central Asia are carried in central Asia by the westerly and southwesterly during El Niños [19]. This may have contributed to the high (low) rainfall in Xinjiang during El Niño (La Niña) [82]. Climate oscillations and their associated effects vary in signal strength from cycle to cycle. The possible explanation for this is the modulation of one oscillation by the cycle of another. One of the most studied coupling effects is the ENSO and PDO relationship [83]. Previous study have shown that the constructive periods of ENSO and PDO (warm phase ENSO, positive phase PDO) resulted in magnified precipitation effects in seasonal regimes [84]. The current study indicates that synchronous PDO may lead to variations in annual-scale drought, with a maximum positive correlation between the two (Figure 8c). Positive (negative) phase PDO favors to wetness (dryness) in Xinjiang, which is consistent with the effect of ENSO mode on drying and wetting variations in the region. Literature has shown that ENSO signal is enhanced with stronger associated sea level pressure anomalies during the constructive phases of ENSO and PDO [85]. Hence, the constructive epochs of ENSO and PDO may exacerbate dry/wet variations in the region. The coupling of warm-phase ENSO and positive-phase PDO is more favorable to wetting in Xinjiang, whereas coupling of cold-phase ENSO and negative-phase PDO may exacerbate drought in the region.
Drought variations in Xinjiang are not only caused by changes in climatic factors, but also the results of large-scale oceanic and atmospheric circulation modes and regional geomorphology [86]. AMO fluctuation indicates a significant correlation with the long-term rainfall variability [70]. It has been reported that the positive-phase AMO corresponded to the dry period in Xinjiang after 1997 [10]. AMO dominated the interannual-scale drought behavior in Xinjiang among the four teleconnection signals. Both synchronous and asynchronous correlations indicate a significant negative correlation between AMO and drought variation. This means that AMO in positive (negative) phase likely contributes to dryness (wetness) in Xinjiang. The correspondent pattern appear to be more pronounced since the mid-1980s. A possible explanation for this is that AMO influences rainfall in China through the Silk Road teleconnection pattern. The positive phase in AMO is associated with the negative Silk Road pattern which comprises of a wave-train with an anti-cyclonic anomaly over western Asia, a cyclonic anomaly over central Asia. This teleconnection pattern results in suppressed rainfall over the Northwest China [20]. On the internal atmospheric variations, teleconnections and the local land-atmosphere interactions, the teleconnection patterns, such as the Silk Road mode and the Europe China mode are also responsible for the summer precipitation variations in Northwest China [31].
The Arctic Oscillation (AO) is considered as the most dominant mode that influences the Northern Hemisphere wintertime climate change [15]. AO index has been in positive phase more since the 1980s in comparison to earlier times [38]. When the AO is positive, the monsoon is weak, and temperature and precipitation increase over China [15]. The current study shows that AO is negatively correlated with meteorological drought (SPEI-3) and agricultural drought (SPEI-6), and the positive phase in AO may have influence on short-term drought variability to a certain extent, thus exacerbating drought conditions in Xinjiang since the 1990s. According to available research, the increase in Xinjiang precipitation is mainly related to the enhancement of ocean evaporation caused by global warming, anomalous activities of the South Asian monsoon and the subtropical high, increased water vapor transport due to the increase in the westerly circulation index and teleconnection of the Northern Hemisphere atmosphere circulation [61]. In addition, the Arctic Oscillation (AO), the North Atlantic Oscillation (NAO) and the area of Northern Hemisphere polar vortex exerted certain influence on air moisture in arid region of Northwest China [15,43].
Oceanic atmospheric interaction modes are regional processes with a broad global influence, the net effect of these processes on drought variability varies region by region. This study complements previous work in Xinjiang region [9,10,18,45,64] by the inclusion of additional climatic signals (e.g., AO). For a given hydro-climatic system, its essential to understand the link between the individual and combined effects of climatic modes at the regional scale [70]. The present study analyzes the individual and joint effects of climate signals on Xinjiang drought by using a stepwise multiple regression based on synchronous and asynchronous modes. Moreover, the length of hydro-climatic time series is an important aspect in climate analysis [7]. This study provides an evaluation of climate drivers for Xinjiang long-term drought from 1951 to 2020, covering a period of up to 70 years, which is rare in previous work. Furthermore, we discuss the response mechanism of drought behavior to teleconnection modes from the perspective of regional climate parameters, i.e., precipitation and temperature, by using a partial correlation analysis. This has not been documented in previous or recent studies. To this regard, the current work may provide some novel insights for future studies in drought attribution.
6. Conclusions and Recommendations
The present study evaluates the teleconnection effects of ocean-atmospheric interactions on long-term drought variation in Xinjiang over the last seven decades. The impact of teleconnection as internal atmospheric variability on climate behavior in Xinjiang was analyzed based on synchronous and asynchronous correlations. Stepwise regression models were used to detect the leading climate modes on short- and long-term drought variability. Partial correlation analysis was applied to discuss the influencing mechanism of teleconnections on drought evolution from the perspective of regional climate factors. Main findings from this study are as follows:
- (i).
- Hydroclimatic conditions in Xinjiang exhibit a persistently fluctuating dry condition since the late 1990s. Short-term drought variability (SPEI-3, SPEI-6, SPEI-12) indicates the occurrence of intermittent wetness. However, long-term drought variability (SPEI-24, SPEI-36, SPEI-48) indicates that hydrological system has been in a prolonged dry epoch on interannual timescale.
- (ii).
- The synchronous ENSO exhibit significant positive correlation with Xinjiang dry and wet variations. El Niño favors wetness in Xinjiang, while La Niña may exacerbate drought effect in the region. The contemporaneous and lagged stepwise regression models indicate that the effect of ENSO on regional drought is relatively weak among the four teleconnection modes. Moreover, the annual drought variation (SPEI-12) reaches an anti-phase peak in response to ENSO at a lag of around 1-year, showing a maximum negative correlation. This suggests the delayed effect of ENSO on drought behavior, that not only through cold and warm phases (El Niño and La Niña), but also through the precursor patterns to affect drought variability in the region.
- (iii).
- In comparison with asynchronous patterns, synchronous PDO has a stronger effect on Xinjiang drought, indicating a significant positive correlation between the two. Positive (negative) phase PDO may contribute to the wet (dry) period in the region. This teleconnection effect is consistent with the impact of ENSO mode on dry/wet variations. Synchronous PDO is the dominant signal for annual-scale drought variation in Xinjiang among four oceanic atmospheric oscillations. Given the coupling effect of ENSO and PDO, the impacts of in-phase ENSO and PDO on regional drought may have a superposition effect, hence the combination of cold-phase ENSO (La Niña) and negative-phase PDO may exacerbate the drought states in Xinjiang.
- (iv).
- Both synchronous and asynchronous AMO signal indicates a significant negative correlation with the drought variations. Positive (negative) phase AMO may in favor of the dryness (wetness) in Xinjiang. The AMO has shown an anti-phase fluctuation with regional drought behavior since the mid-1980s. Furthermore, AMO appears a significant impact on long-term drought variability. Among four ocean-atmospheric circulation indices, AMO is the predominant teleconnection for interannual-scale drought evolution in Xinjiang.
- (v).
- The significant negative correlation between synchronous AO and SPEI indicates that positive (negative) phase in AO may contribute to Xinjiang dry (wet) epochs. A hot spot in synchronous correlation of AO and SPEI occurs within 12-month time window, indicating that AO mainly affects the intra-annual scale drought variability over Xinjiang. However as the lag time increases, the anti-phase variation transforms to in-phase over a delay-time of 1-year, with a maximum positive correlation during the lag time of 1–2-year. These findings embody the high complexity in the effect of AO on Xinjiang drought behavior.
- (vi).
- Teleconnections show positive correlation with Xinjiang precipitation on intra-annual to inter-annual time scales, except for AO, which is negatively correlated with precipitation within a 2-year moving window. Oceanic atmospheric circulation indices indicate positive correlation with regional temperature, with the correlation increased by increasing time scale. On intra-annual to short-term inter-annual scales, ENSO and PDO mainly affect Xinjiang drought by influencing regional precipitation, with no teleconnection effect of the two on temperature variability. However, AMO acts mainly on the dry/wet variation in Xinjiang by affecting regional temperature on both intra-annual and interannual timescales. The AO signal has a certain effect on precipitation variability among short-term drought behavior.
Identification and characterization of drought are challenging due to its highly spatiotemporal variability, complicated physical process and non-structural impacts [45,87]. The SPEI is coupled with climatic water supply (precipitation) and demand (PET), making it sensitive to variation in PET [10]. The Thornthwaite model was used in this study to consider the ET effect. This method considers only monthly precipitation and temperature, and main advantage is the simplicity in its calculation, since data are readily available for most global areas. The disadvantage is that it can not take into account variations in solar and infrared radiation, humidity and wind speed [23]. Moreover, this equation leads to an overestimation of PET with increasing air temperature, and it can not accurately estimate the evolution of PET in recent decades [72]. The Penman–Monteith [88] method should be consider so as to incorporate additional meteorological factors if sufficient meteorological information is available.
It should be noted that the small number and uneven spatial distribution of meteorological stations in Xinjiang, especially in southern Xinjiang, may lead to some uncertainty in the analysis results. The Tianshan Mountains play an important role in natural conditions. Precipitation in North Xinjiang (north of Tianshan Mountains) is greater than that in South Xinjiang (south of Tianshan Mountains) [43]. The climate conditions in the northern and southern parts of Xinjiang are different affected by topography and atmospheric circulation [10]. The spatial variability in Xinjiang climate [89] may cause regional climate behavior to respond differently to internal atmospheric process. Future studies could account for the heterogeneity in the effects of climate signals on droughts in the north Xinjiang and south Xinjiang. Drought turning point occurred in the late 1990s (the year 1997) [10,63]. The sensitivity of drought index to teleconnections may differ before and after the turning point [86], and it is worthwhile to further investigate the impacts of climate patterns on Xinjiang drought in dry and wet epochs. The causes for drought can vary seasonally, with different factors affecting summer versus winter precipitation [16], however a broader view focused on mean patterns was considered in this study. Future studies could focus on teleconnection effects of climate signals on seasonal drought behavior (e.g., [31]). Given the peak mode of negative correlation between AO index and SPEI-6, it is recommended to study the relationship between AO and short-term drought variability in Xinjiang. Furthermore, Xinjiang is affected by the westerly circulation system, the precipitation in arid central Asia depends on the amount of water vapor transported by mid-latitude westerlies from the North Atlantic Ocean, and from inland seas and lakes along the westerly cyclonic storm paths [15]. Other ocean-atmospheric indices should be incorporated for performing a more comprehensive study, such as North Atlantic Oscillation (NAO).
The current study provides favorable information for improving long-term drought forecasting in Xinjiang from the perspectives of internal atmospheric variability and large-scale climate signals. The findings contribute to drought risk mitigation and water resources management under the influence of natural climate variability. However, since the pressure and temperature variations over the Pacific Ocean move gradually to other ocean basins through the general circulation of atmosphere, the global patterns such as ENSO and AMO, remote connection based on atmospheric general circulation is evident [38]. There may be independent or complementary effects between ENSO and other ocean-atmospheric oscillations (PDO, AMO and AO) [90]. In addition to this, the impacts of fluctuations in SST on precipitation and drought conditions may change in terms of magnitude and spatial pattern under the influence of global warming [20]. These challenges suggest the necessity to analyze the robustness of these findings in future studies through sensitivity experiments of atmospheric circulation patterns based on climate dynamics.
Author Contributions
Conceptualization, B.X. and R.Y.; methodology, R.Y. and B.X.; resources and supervision, B.X.; software and visualization, R.Y.; writing—original draft preparation, R.Y.; writing—review and editing, B.X. and R.Y. All authors have read and agreed to the published version of the manuscript.
Funding
This research was funded by the Science and Technology Research Project of Chongqing Municipal Education Commission upon the grant number of KJQN201800711.
Institutional Review Board Statement
Not applicable.
Informed Consent Statement
Not applicable.
Data Availability Statement
The land cover data were obtained from the Resource and Environment Science and Data Center, Chinese Academy of Sciences (CAS) (https://www.resdc.cn/, accessed on 11 December 2021). Precipitation and temperature data were all derived from the National Climate Center of the China Meteorological Administration (http://cmdp.ncc-cma.net/cn/download.htm, accessed on 21 October 2021). The monthly time series of climate indices, i.e., Nino3.4, PDO, AMO, and AO were derived from the Physical Sciences Laboratory, National Oceanic and Atmospheric Administration (https://psl.noaa.gov/, accessed on 29 Novermber 2021).
Acknowledgments
The authors are grateful to the Resource and Environmental Science and Data Center of the Chinese Academy of Sciences for providing the land cover data. The National Climate Center (NCC) of the China Meteorological Administration (CMA) is appreciated for providing the meteorological datasets. The authors thank Physical Sciences Laboratory (PSL), National Oceanic and Atmospheric Administration (NOAA) for providing the monthly series of climate indices. This study is financially supported by the Science and Technology Research Project of Chongqing Municipal Education Commission upon the grant number of KJQN201800711. The authors appreciate the academic editor and anonymous reviewers for their insightful suggestions, which greatly improved the quality of the manuscript. We also thank Zack Wang/Assistant Editor for helping us in the process of publishing this paper.
Conflicts of Interest
The authors declare no conflict of interest.
References
- An, Q.; He, H.; Gao, J.; Nie, Q.; Cui, Y.; Wei, C.; Xie, X. Analysis of Temporal-Spatial Variation Characteristics of Drought: A Case Study from Xinjiang, China. Water 2020, 12, 741. [Google Scholar] [CrossRef] [Green Version]
- Mishra, A.; Singh, V. A review of drought concepts. J. Hydrol. 2010, 391, 202–216. [Google Scholar] [CrossRef]
- Wang, R.; Peng, W.; Liu, X.; Wu, W.; Chen, X.; Zhang, S. Responses of Water Level in China’s Largest Freshwater Lake to the Meteorological Drought Index (SPEI) in the Past Five Decades. Water 2018, 10, 137. [Google Scholar] [CrossRef] [Green Version]
- Gong, X.; Du, S.; Li, F.; Ding, Y. Study on the Spatial and Temporal Characteristics of Mesoscale Drought in China under Future Climate Change Scenarios. Water 2021, 13, 2761. [Google Scholar] [CrossRef]
- Gao, L.; Zhang, Y. Spatio-temporal variation of hydrological drought under climate change during the period 1960–2013 in the Hexi Corridor, China. J. Arid Land 2016, 8, 157–171. [Google Scholar] [CrossRef] [Green Version]
- Wu, Y.; Bake, B.; Zhang, J.; Rasulov, H. Spatio-temporal patterns of drought in North Xinjiang, China, 1961–2012 based on meteorological drought index. J. Arid Land 2015, 7, 527–543. [Google Scholar] [CrossRef] [Green Version]
- Khan, A.; Zhao, Y.; khan, J.; Rahman, G.; Rafiq, M.; Moazzam, M. Spatial and Temporal Analysis of Rainfall and Drought Condition in Southwest Xinjiang in Northwest China, Using Various Climate Indices. Environ. Earth Sci. 2021, 5, 201–216. [Google Scholar] [CrossRef]
- Yao, J.; Zhao, Y.; Yu, X. Spatial-temporal variation and impacts of drought in Xinjiang (Northwest China) during 1961–2015. PeerJ 2018, 06, e4926. [Google Scholar] [CrossRef] [Green Version]
- Zhu, J.; Zhou, L.; Huang, S. A hybrid drought index combining meteorological, hydrological, and agricultural information based on the entropy weight theory. Arab. J. Geosci. 2018, 11, 91. [Google Scholar] [CrossRef]
- Yao, J.; Tuoliewubieke, D.; Chen, J.; Huo, W.; Hu, W. Identification of Drought Events and Correlations with Large-Scale Ocean–Atmospheric Patterns of Variability: A Case Study in Xinjiang, China. Atmosphere 2019, 10, 94. [Google Scholar] [CrossRef] [Green Version]
- Ault, T. On the essentials of drought in a changing climate. Science 2020, 368, 256–260. [Google Scholar] [CrossRef] [PubMed]
- Wolff, C.; Haug, G.; Timmermann, A.; Damsté, J.; Brauer, A.; Sigman, D.; Cane, M.; Verschuren, D. Reduced Interannual Rainfall Variability in East Africa During the Last Ice Age. Science 2011, 333, 743–747. [Google Scholar] [CrossRef] [PubMed]
- Rajsekhar, D.; Gorelick, S. Increasing drought in Jordan: Climate change and cascading Syrian land-use impacts on reducing transboundary flow. Sci. Adv. 2017, 3, e1700581. [Google Scholar] [CrossRef] [Green Version]
- Kaniewski, D.; Marriner, N.; Ilan, D.; Morhange, C.; Thareani, Y.; Campo, E. Climate change and water management in the biblical city of Dan. Sci. Adv. 2017, 3, e1700954. [Google Scholar] [CrossRef] [Green Version]
- Wang, H.; Chen, Y.; Pan, Y.; Li, W. Spatial and temporal variability of drought in the arid region of China and its relationships to teleconnection indices. J. Hydrol. 2015, 523, 283–296. [Google Scholar] [CrossRef]
- Erb, M.; Emile-Geay, J.; Hakim, G.; Steiger, N.; Steig, E. Atmospheric dynamics drive most interannual U.S. droughts over the last millennium. Sci. Adv. 2020, 6, eaay7268. [Google Scholar] [CrossRef] [PubMed]
- Yoon, J.; Wang, S.; Gillies, R.; Kravitz, B.; Hipps, L.; Rasch, P. Spatiotemporal variations in extreme precipitation on the middle and lower reaches of the Yangtze River Basin (1970–2018). Nat. Commun. 2015, 6, 8657. [Google Scholar] [CrossRef] [PubMed] [Green Version]
- Kalra, A.; Li, L.; Li, X.; Ahmad, S. Improving Streamflow Forecast Lead Time Using Oceanic-Atmospheric Oscillations for Kaidu River Basin, Xinjiang, China. J. Hydrol. Eng. 2013, 18, 1031–1040. [Google Scholar] [CrossRef]
- Hu, Z.; Chen, X.; Chen, D.; Li, J.; Wang, S.; Zhou, Q.; Yin, G.; Guo, M. “Dry gets drier, wet gets wetter”: A case study over the arid regions of central Asia. Int. J. Climatol. 2019, 39, 1072–1091. [Google Scholar] [CrossRef]
- Apurv, T.; Xu, Y.; Wang, Z.; Cai, X. Multidecadal Changes in Meteorological Drought Severity and Their Drivers in Mainland China. J. Geophys. Res. Atmos. 2019, 124, 12937–12952. [Google Scholar] [CrossRef]
- Zhang, K.; Dai, S.; Dong, X. Dynamic Variability in Daily Temperature Extremes and Their Relationships with Large-scale Atmospheric Circulation During 1960–2015 in Xinjiang, China. Chin. Geogr. Sci. 2020, 30, 233–248. [Google Scholar] [CrossRef] [Green Version]
- Li, Z.; Chen, Y.; Fang, G.; Li, Y. Multivariate assessment and attribution of droughts in Central Asia. Sci. Rep. 2017, 7, 1316. [Google Scholar] [CrossRef] [PubMed]
- Trenberth, K.; Dai, A.; van der Schrier, G.; Jones, P.; Barichivich, J.; Briffa, K.; Sheffield, J. Global warming and changes in drought. Nat. Clim. Chang. 2014, 4, 17–22. [Google Scholar] [CrossRef]
- Timmermann, A.; An, S.; Kug, J.; Jin, F.; Cai, W.; Capotondi, A.; Cobb, K.; Lengaigne, M.; McPhaden, M.; Stuecker, M.; et al. El Niño–Southern Oscillation complexity. Nature 2018, 559, 535–545. [Google Scholar] [CrossRef] [PubMed]
- McPhaden, M.; Zebiak, S.; Glantz, M. ENSO as an Integrating Concept in Earth Science. Science 2006, 314, 1740–1745. [Google Scholar] [CrossRef] [PubMed] [Green Version]
- Yan, Z.; Wu, B.; Li, T.; Collins, M.; Clark, R.; Zhou, T.; Murphy, J.; Tan, G. Eastward shift and extension of ENSO-induced tropical precipitation anomalies under global warming. Sci. Adv. 2020, 6, eaax4177. [Google Scholar] [CrossRef] [PubMed] [Green Version]
- Cai, W.; Wu, L.; Lengaigne, M.; Li, T.; McGregor, S.; Kug, J.; Yu, J.; Stuecker, M.; Santoso, A.; Li, X.; et al. Pantropical climate interactions. Science 2019, 363, eaav4236. [Google Scholar] [CrossRef] [Green Version]
- Cobb, K.; Westphal, N.; Sayani, H.; Watson, J.; Lorenzo, E.; Cheng, H.; Edwards, R.; Charles, C. Highly Variable El Nino-Southern Oscillation Throughout the Holocene. Science 2013, 339, 67–70. [Google Scholar] [CrossRef] [PubMed] [Green Version]
- Emerton, R.; Cloke, H.; Stephens, E.; Zsoter, E.; Woolnough, S.; Pappenberger, F. Complex picture for likelihood of ENSO-driven flood hazard. Nat. Commun. 2017, 8, 14796. [Google Scholar] [CrossRef] [Green Version]
- Hu, Z.; Kumar, A.; Zhu, J.; Huang, B.; Tseng, Y.; Wang, X. On the Shortening of the Lead Time of Ocean Warm Water Volume to ENSO SST Since 2000. Sci. Rep. 2017, 7, 4294. [Google Scholar] [CrossRef] [Green Version]
- Lu, B.; Li, H.; Wu, J.; Zhang, T.; Liu, J.; Liu, B.; Chen, Y.; Baishan, J. Impact of El Niño and Southern Oscillation on the summer precipitation over Northwest China. Atmos. Sci. Lett. 2019, 20, e928. [Google Scholar] [CrossRef] [Green Version]
- Kayano, M.; Andreoli, R.; Cerón, W.; Souza, R. The Role of the Indian Ocean Basin-Wide and El Niño–Southern Oscillation Modes in Interannual Rainfall Variability over South America during Austral Summer. Atmosphere 2021, 12, 1094. [Google Scholar] [CrossRef]
- Carré, M.; Sachs, J.; Purca, S.; Schauer, A.; Braconnot, P.; Falcón, R.; Julien, M.; Lavallée, D. Holocene history of ENSO variance and asymmetry in the eastern tropical Pacific. Science 2014, 345, 1045–1048. [Google Scholar] [CrossRef] [PubMed]
- Zhang, L.; Liu, Y.; Zhan, H.; Jin, M.; Liang, X. Influence of solar activity and EI Niño-Southern Oscillation on precipitation extremes, streamflow variability and flooding events in an arid-semiarid region of China. J. Hydrol. 2021, 601, 126630. [Google Scholar] [CrossRef]
- Zhou, L.; Wang, S.; Du, M.; Chen, Q.; He, C.; Zhang, J.; Zhu, Y.; Gong, Y. The Influence of ENSO and MJO on Drought in Different Ecological Geographic Regions in China. Remote Sens. 2021, 13, 875. [Google Scholar] [CrossRef]
- Dai, A. Drought under global warming: A review. Wiley Interdiscip. Rev. Clim. Chang. 2011, 2, 45–65. [Google Scholar] [CrossRef] [Green Version]
- Balling, R.; Goodrich, G. Analysis of drought determinants for the Colorado River Basin. Clim. Chang. 2007, 82, 179–194. [Google Scholar] [CrossRef]
- Ahmadi, M.; Salimi, S.; Hosseini, S.; Poorantiyosh, H.; Bayat, A. Iran’s precipitation analysis using synoptic modeling of major teleconnection forces (MTF). Dyn. Atmos. Ocean. 2019, 85, 41–56. [Google Scholar] [CrossRef]
- Hanley, D.; Bourassa, M.; O’Brien, J.; Smith, S.; Spade, E. A Quantitative Evaluation of ENSO Indices. J. Clim. 2003, 16, 1249–1258. [Google Scholar] [CrossRef]
- Biabanaki, M.; Eslamian, S.; Koupai, J.; Cañón, J.; Boni, G.; Gheysari, M. A principal components/singular spectrum analysis approach to ENSO and PDO influences on rainfall in western Iran. Hydrol. Res. 2013, 45, 250–262. [Google Scholar] [CrossRef]
- Mann, M.; Steinman, B.; Brouillette, D.; Miller, S. Multidecadal climate oscillations during the past millennium driven by volcanic forcing. Science 2021, 371, 1014–1019. [Google Scholar] [CrossRef] [PubMed]
- Noorisameleh, Z.; Gough, W.; Mirza, M. Persistence and spatial–temporal variability of drought severity in Iran. Environ. Sci. Pollut. Res. 2021, 28, 48808–48822. [Google Scholar] [CrossRef] [PubMed]
- Chen, D.; Liu, W.; Huang, F.; Li, Q.; Uchenna-Ochege, F.; Li, L. Spatial-temporal characteristics and influencing factors of relative humidity in arid region of Northwest China during 1966–2017. J. Arid Land 2020, 12, 397–412. [Google Scholar] [CrossRef]
- Zhang, F.; Wang, C.; Wang, Z. Response of Natural Vegetation to Climate in Dryland Ecosystems: A Comparative Study between Xinjiang and Arizona. Remote Sens. 2020, 12, 3567. [Google Scholar] [CrossRef]
- Guo, H.; Bao, A.; Liu, T.; Jiapaer, G.; Ndayisaba, F.; Jiang, L.; Kurban, A.; De Maeyer, P. Spatial and temporal characteristics of droughts in Central Asia during 1966–2015. Sci. Total Environ. 2018, 624, 1523–1538. [Google Scholar] [CrossRef] [PubMed]
- Nouri, M.; Homaee, M. Drought trend, frequency and extremity across a wide range of climates over Iran. Meteorol. Appl. 2020, 27, e1899. [Google Scholar] [CrossRef]
- Vicente-Serrano, S.; Beguería, S.; López-Moreno, J. A Multiscalar Drought Index Sensitive to Global Warming The Standardized Precipitation Evapotranspiration Index. J. Clim. 2010, 23, 1696–1718. [Google Scholar] [CrossRef] [Green Version]
- Manatsa, D.; Mushore, T.; Lenouo, A. Improved predictability of droughts over southern Africa using the standardized precipitation evapotranspiration index and ENSO. Theor. Appl. Climatol. 2017, 127, 259–274. [Google Scholar] [CrossRef]
- Stojanovic, M.; Liberato, M.; Sorí, R.; Vázquez, M.; Phan-Van, T.; Duongvan, H.; Hoang Cong, T.; Nguyen, P.; Nieto, R.; Gimeno, L. Trends and Extremes of Drought Episodes in Vietnam Sub-Regions during 1980–2017 at Different Timescales. Water 2020, 12, 813. [Google Scholar] [CrossRef] [Green Version]
- Yao, J.; Mao, W.; Chen, J.; Dilinuer, T. Recent signal and impact of wet-to-dry climatic shift in Xinjiang, China. J. Geogr. Sci. 2021, 31, 1283–1298. [Google Scholar] [CrossRef]
- Tan, X.; Shao, D. Precipitation trends and teleconnections identified using quantile regressions over Xinjiang, China: Variability and changes identified by quantile regressions. Int. J. Climatol. 2016, 37, 1510–1525. [Google Scholar] [CrossRef]
- Kambezidis, H.; Li, Y.; Zhou, M. Trends in Dryness Index Based on Potential Evapotranspiration and Precipitation over 1961–2099 in Xinjiang, China. Adv. Meteorol. 2014, 2014, 548230. [Google Scholar] [CrossRef] [Green Version]
- Zhou, Y.; Huang, A.; Zhao, Y.; Yang, Q.; Jiang, J.; La, M. Influence of the sea surface temperature anomaly over the Indian Ocean in March on the summer rainfall in Xinjiang. Theor. Appl. Climatol. 2015, 119, 781–789. [Google Scholar] [CrossRef] [Green Version]
- Li, Y.; Sun, C. Impacts of the superimposed climate trends on droughts over 1961–2013 in Xinjiang, China. Theor. Appl. Climatol. 2017, 129, 977–994. [Google Scholar] [CrossRef]
- Luo, N.; Yu, R.; Mao, D.; Wen, B.; Liu, X. Spatiotemporal variations of wetlands in the northern Xinjiang with relationship to climate change. Wetl. Ecol. Manag. 2021, 29, 617–631. [Google Scholar] [CrossRef]
- Ning, G.; Luo, M.; Zhang, Q.; Wang, S.; Liu, Z.; Yang, Y.; Wu, S.; Zeng, Z. Understanding the Mechanisms of Summer Extreme Precipitation Events in Xinjiang of Arid Northwest China. J. Geophys. Res. Atmos. 2021, 126, e2020JD034111. [Google Scholar] [CrossRef]
- Yang, P.; Xia, J.; Zhan, C.; Zhang, Y.; Hu, S. Discrete wavelet transform-based investigation into the variability of standardized precipitation index in Northwest China during 1960–2014. Theor. Appl. Climatol. 2018, 132, 167–180. [Google Scholar] [CrossRef]
- Wang, J.; Chen, F.; Jin, L.; Bai, H. Characteristics of the dry/wet trend over arid central Asia over the past 100 years. Clim. Res. 2010, 41, 51–59. [Google Scholar] [CrossRef] [Green Version]
- Yang, P.; Xia, J.; Zhang, Y.; Han, J.; Wu, X. Quantile regression and clustering analysis of standardized precipitation index in the Tarim River Basin, Xinjiang, China. Theor. Appl. Climatol. 2018, 134, 901–912. [Google Scholar] [CrossRef]
- Zhang, Y.; An, C.; Liu, L.; Zhang, W.; Lu, C.; Zhang, Y. High Mountains Becoming Wetter While Deserts Getting Drier in Xinjiang, China since the 1980s. Land 2021, 10, 1131. [Google Scholar] [CrossRef]
- Wang, Q.; Zhai, P.; Qin, D. New perspectives on `warming–wetting’ trend in Xinjiang, China. Adv. Clim. Chang. Res. 2020, 11, 252–260. [Google Scholar] [CrossRef]
- Yang, H.; Xu, J.; Chen, Y.; Li, D.; Zuo, J.; Zhu, N.; Chen, Z. Has the Bosten Lake Basin been dry or wet during the climate transition in Northwest China in the past 30 years? Theor. Appl. Climatol. 2020, 141, 627–644. [Google Scholar] [CrossRef]
- Chen, Y.; Li, W.; Deng, H.; Fang, G.; Li, Z. Changes in Central Asia’s Water Tower: Past, Present and Future. Sci. Rep. 2016, 6, 35458. [Google Scholar] [CrossRef] [PubMed]
- Hu, W.; Yao, J.; He, Q.; Chen, J. Changes in precipitation amounts and extremes across Xinjiang (northwest China) and their connection to climate indices. PeerJ 2021, 9, e10792. [Google Scholar] [CrossRef] [PubMed]
- Pettitt, A. A Non-Parametric Approach to the Change-Point Problem. J. R. Stat. Soc. Ser. C (Appl. Stat.) 1979, 28, 126–135. [Google Scholar] [CrossRef]
- Alexandersson, H. A Homogeneity Test Applied to Precipitation Data. Int. J. Climatol. 1986, 6, 661–675. [Google Scholar] [CrossRef]
- Buishand, T. Some methods for testing the homogeneity of rainfall records. J. Hydrol. 1982, 58, 11–27. [Google Scholar] [CrossRef]
- Ye, X.; Wu, Z. Contrasting Impacts of ENSO on the Interannual Variations of Summer Runoff between the Upper and Mid-Lower Reaches of the Yangtze River. Atmosphere 2018, 9, 478. [Google Scholar] [CrossRef] [Green Version]
- Yang, Y.; Xie, N.; Gao, M. The Relationship between the Wintertime Cold Extremes over East Asia with Large-Scale Atmospheric and Oceanic Teleconnections. Atmosphere 2019, 10, 813. [Google Scholar] [CrossRef] [Green Version]
- Abiy, A.; Melesse, A.; Abtew, W. Teleconnection of Regional Drought to ENSO, PDO, and AMO: Southern Florida and the Everglades. Atmosphere 2019, 10, 295. [Google Scholar] [CrossRef] [Green Version]
- Yan, W.; He, Y.; Cai, Y.; Cui, X.; Qu, X. Analysis of Spatiotemporal Variability in Extreme Climate and Potential Driving Factors on the Yunnan Plateau (Southwest China) during 1960–2019. Atmosphere 2021, 12, 1136. [Google Scholar] [CrossRef]
- Beguería, S.; Vicente-Serrano, S.; Reig, F.; Latorre, B. Standardized precipitation evapotranspiration index (SPEI) revisited: Parameter fitting, evapotranspiration models, tools, datasets and drought monitoring. Int. J. Climatol. 2014, 34, 3001–3023. [Google Scholar] [CrossRef] [Green Version]
- Thornthwaite, C. An Approach toward a Rational Classification of Climate. Geogr. Res. 1948, 38, 55–94. [Google Scholar] [CrossRef]
- Helali, J.; Salimi, S.; Lotfi, M.; Hosseini, S.; Bayat, A.; Ahmadi, M.; Naderizarneh, S. Investigation of the effect of large-scale atmospheric signals at different time lags on the autumn precipitation of Iran’s watersheds. Arab. J. Geosci. 2020, 13, 932. [Google Scholar] [CrossRef]
- Onwuegbuzie, A.; Collins, K. A Typology of Mixed Methods Sampling Designs in Social Science Research. Qual. Rep. 2007, 12, 281–316. [Google Scholar] [CrossRef]
- Zhong, Y.; Wang, B.; Zou, C.; Hu, B.; Liu, Y.; Hao, Y. On the teleconnection patterns to precipitation in the eastern Tianshan Mountains, China. Clim. Dyn. 2017, 49, 3123–3139. [Google Scholar] [CrossRef]
- Mohammadrezaei, M.; Soltani, S.; Modarres, R. Evaluating the effect of ocean-atmospheric indices on drought in Iran. Theor. Appl. Climatol. 2020, 140, 219–230. [Google Scholar] [CrossRef]
- Choubin, B.; Khalighi-Sigaroodi, S.; Malekian, A.; Ahmad, S.; Attarod, P. Drought forecasting in a semi-arid watershed using climate signals: A neuro-fuzzy modeling approach. J. Mt. Sci. 2014, 11, 1593–1605. [Google Scholar] [CrossRef]
- Zhou, H.; Liu, Y. Spatio-temporal pattern of meteorological droughts and its possible linkage with climate variability. Int. J. Climatol. 2017, 38, 2082–2096. [Google Scholar] [CrossRef]
- Wu, J.; Tan, X.; Chen, X.; Lin, K. Dynamic changes of the dryness/wetness characteristics in the largest river basin of South China and their possible climate driving factors. Atmos. Res. 2020, 232, 104685. [Google Scholar] [CrossRef]
- Yang, Y.; Wu, L.; Guo, Y.; Gan, B.; Cai, W.; Huang, G.; Li, X.; Geng, T.; Jing, Z.; Li, S.; et al. Greenhouse warming intensifies north tropical Atlantic climate variability. Sci. Adv. 2021, 7, eabg9690. [Google Scholar] [CrossRef] [PubMed]
- Kim, J.; Kug, J.; Jeong, S. Intensification of terrestrial carbon cycle related to El Niño–Southern Oscillation under greenhouse warming. Nat. Commun. 2017, 8, 1674. [Google Scholar] [CrossRef] [PubMed] [Green Version]
- Stevens, K.; Ruscher, P. Large scale climate oscillations and mesoscale surface meteorological variability in the Apalachicola-Chattahoochee-Flint River Basin. J. Hydrol. 2014, 517, 700–714. [Google Scholar] [CrossRef]
- Rajagopalan, B.; Cook, E.; Lall, U.; Ray, B. Spatiotemporal Variability of ENSO and SST Teleconnections to Summer Drought over the United States during the Twentieth Century. J. Clim. 2000, 13, 4244–4255. [Google Scholar] [CrossRef]
- Gershunov, A.; Barnett, T. Interdecadal Modulation of ENSO Teleconnections. Bull. Am. Meteorol. Soc. 1998, 79, 2715–2726. [Google Scholar] [CrossRef] [Green Version]
- Kubota, H.; Wu, Y.; Zhang, G.; Shen, H.; Xu, Y.; Bake, B. Attribute Analysis of Aridity Variability in North Xinjiang, China. Adv. Meteorol. 2016, 2016, 9610960. [Google Scholar] [CrossRef] [Green Version]
- Byakatonda, J.; Parida, B.; Moalafhi, D.; Kenabatho, P. Analysis of long term drought severity characteristics and trends across semiarid Botswana using two drought indices. Atmos. Res. 2018, 213, 492–508. [Google Scholar] [CrossRef]
- Allan, R.; Pereira, L.; Smith, M. Crop Evapotranspiration-Guidelines for Computing Crop Water Requirements-FAO Irrigation and Drainage; Food and Agriculture Organization of the United Nations (FAO): Rome, Italy, 1998; Volume 56. [Google Scholar]
- Li, Y.; Yao, N.; Sahin, S.; Appels, W. Spatiotemporal variability of four precipitation-based drought indices in Xinjiang, China. Theor. Appl. Climatol. 2017, 129, 1017–1034. [Google Scholar] [CrossRef]
- Li, C.; Zhao, T. Seasonal Responses of Precipitation in China to El Niño and Positive Indian Ocean Dipole Modes. Atmosphere 2019, 10, 372. [Google Scholar] [CrossRef] [Green Version]
Figure 1.
Land cover over Xinjiang region (2015) with its location in China as well as the geographical position of meteorological stations.
Figure 1.
Land cover over Xinjiang region (2015) with its location in China as well as the geographical position of meteorological stations.

Figure 2.
Monthly SPEI time series during the period of 1997 to 2021 for (a) Xinjiang region and (b) Chinese territory on 1- to 24-month time windows; (c) SPEI-12 time series of China and Xinjiang region; and (d) the difference value between China SPEI-12 and Xinjiang SPEI-12, where the upper (lower) horizontal axis denotes the drought in Xinjiang region is stronger (weaker) than the average state of drought in China.

Figure 3.
Long-term monthly time series of ocean-atmospheric oscillations. (a) El Niño-Southern Oscillation (ENSO) sea surface temperature (SST); (b) Pacific Decadal Oscillation (PDO) index; (c) Atlantic Multidecadal Oscillation (AMO) index; and (d) Arctic Oscillation (AO) index. Red denotes positive phase, and blue denotes negative phase.

Figure 4.
Year month matrix maps for (a) NINO3.4 index; (b) PDO index; (c) AMO index; (d) AO index; (e) monthly precipitation deviation from the long-term average rainfall of the corresponding month; and (f) monthly temperature deviation from the long-term mean temperature of the corresponding month. The vertical axis denotes months from 1 January to 12 December.

Figure 5.
(a) Interannual variability of Standardized Precipitation Evapotranspiration Index (SPEI) at different timescales over Xinjiang, and monthly time series of (b) SPEI6, (c) SPEI12, and (d) SPEI24 during the period of 1951–2020.
Figure 5.
(a) Interannual variability of Standardized Precipitation Evapotranspiration Index (SPEI) at different timescales over Xinjiang, and monthly time series of (b) SPEI6, (c) SPEI12, and (d) SPEI24 during the period of 1951–2020.

Figure 6.
Spatial modes of correlation coefficient between the large scale climate variability (ENSO, PDO, AMO, and AO) and (a) SPEI3, (b) SPEI6, (c) SPEI12, (d) SPEI24, (e) SPEI36, and (f) SPEI48 based on Pearson correlation.
Figure 6.
Spatial modes of correlation coefficient between the large scale climate variability (ENSO, PDO, AMO, and AO) and (a) SPEI3, (b) SPEI6, (c) SPEI12, (d) SPEI24, (e) SPEI36, and (f) SPEI48 based on Pearson correlation.

Figure 7.
Cross-correlation coefficients of Xinjiang SPEIs to (a) ENSO, (b) PDO, (c) AMO, and (d) AO on 1- to 48-month time scales during 1951–2020 with considering lead and lag for 48 months. Horizontal axis represents lead/lag month, and vertical axis represents SPEI at different time scales. On the horizontal axis, −k (+k) indicates that SPEI leads (lags) the climate index by k months.

Figure 8.
Cross-correlation coefficients between Xinjiang SPEI12 and (a) teleconnection indices, (b) ENSO, (c) PDO, (d) AMO, and (e) AO with considering lead and lag for 48 month. Horizontal axis represents lead/lag month, and vertical axis represents correlation coefficient. On the horizontal axis, −k (+k) indicates that SPEI leads (lags) the climate index by k months. Shaded areas indicate SPEI12 lagged teleconnection factor variations.

Figure 9.
Cross-correlation coefficients of Xinjiang SPEIs to (a) ENSO, (b) PDO, (c) AMO, and (d) AO on 3-, 6-, 12-, 24-, 36-, and 48-month timescales, with variation in SPEI lagging teleconnections by 0-24 months. Horizontal axis denotes the SPEI on different timescales, and vertical axis denotes lag month (0–24). k value on vertical axis indicates that SPEI lags climate indices by k months.

Figure 10.
(a) Monthly SPEI series at 12-month time windows, (b) monthly sea surface temperature anomaly (SSTA) for NINO3.4 region, and (c) monthly series of Pacific Decadal Oscillation (PDO) index. Black shadow indicates the low-pass variability with applying a 60-month (5-year) moving average. Light red shaded areas indicate the periods when SPEI12 is in-phase with a single climate pattern, i.e., SPEI12+(−) corresponds to ENSO+(−) or PDO+(−). Double-shaded areas indicate the periods when SPEI12 is in-phase with ENSO and PDO, i.e., SPEI12+(−) corresponds to ENSO+(−) and PDO+(−).

Figure 11.
(a) Monthly SPEI series at 24-month time windows, (b) monthly series of Atlantic Multidecadal Oscillation (AMO) index, and (c) monthly series of Arctic Oscillation (AO) index. Black shadow indicates the low-pass variability with applying a 60-month (5-year) moving average. Light yellow shaded areas indicate the periods when SPEI-24 is anti-phase with a single factor, i.e., SPEI24+(−) corresponds to AMO−(+) or AO−(+). Double-shaded areas indicate the periods when SPEI-24 is anti-phase with AMO and AO, i.e., SPEI24+(−) corresponds to AMO−(+) and AO−(+).

Figure 12.
Pearson correlation coefficients between (a) precipitation and (b) temperature and teleconnection indices (NINO3.4, PDO, AMO, and AO) over Xinjiang on 1- to 48-month time scales during 1951–2020.
Figure 12.
Pearson correlation coefficients between (a) precipitation and (b) temperature and teleconnection indices (NINO3.4, PDO, AMO, and AO) over Xinjiang on 1- to 48-month time scales during 1951–2020.

Figure 13.
Correlation coefficients between Xinjiang SPEI and teleconnection indices (a) ENSO, (b) PDO, (c) AMO, and (d) AO on 1- to 48-month time windows during 1951–2020. White dotes denote correlation between teleconnections and SPEI without external control variable. Blue dotes denote correlation between the two without changing precipitation. Red dotes denote correlation between the two with unchanging temperature.


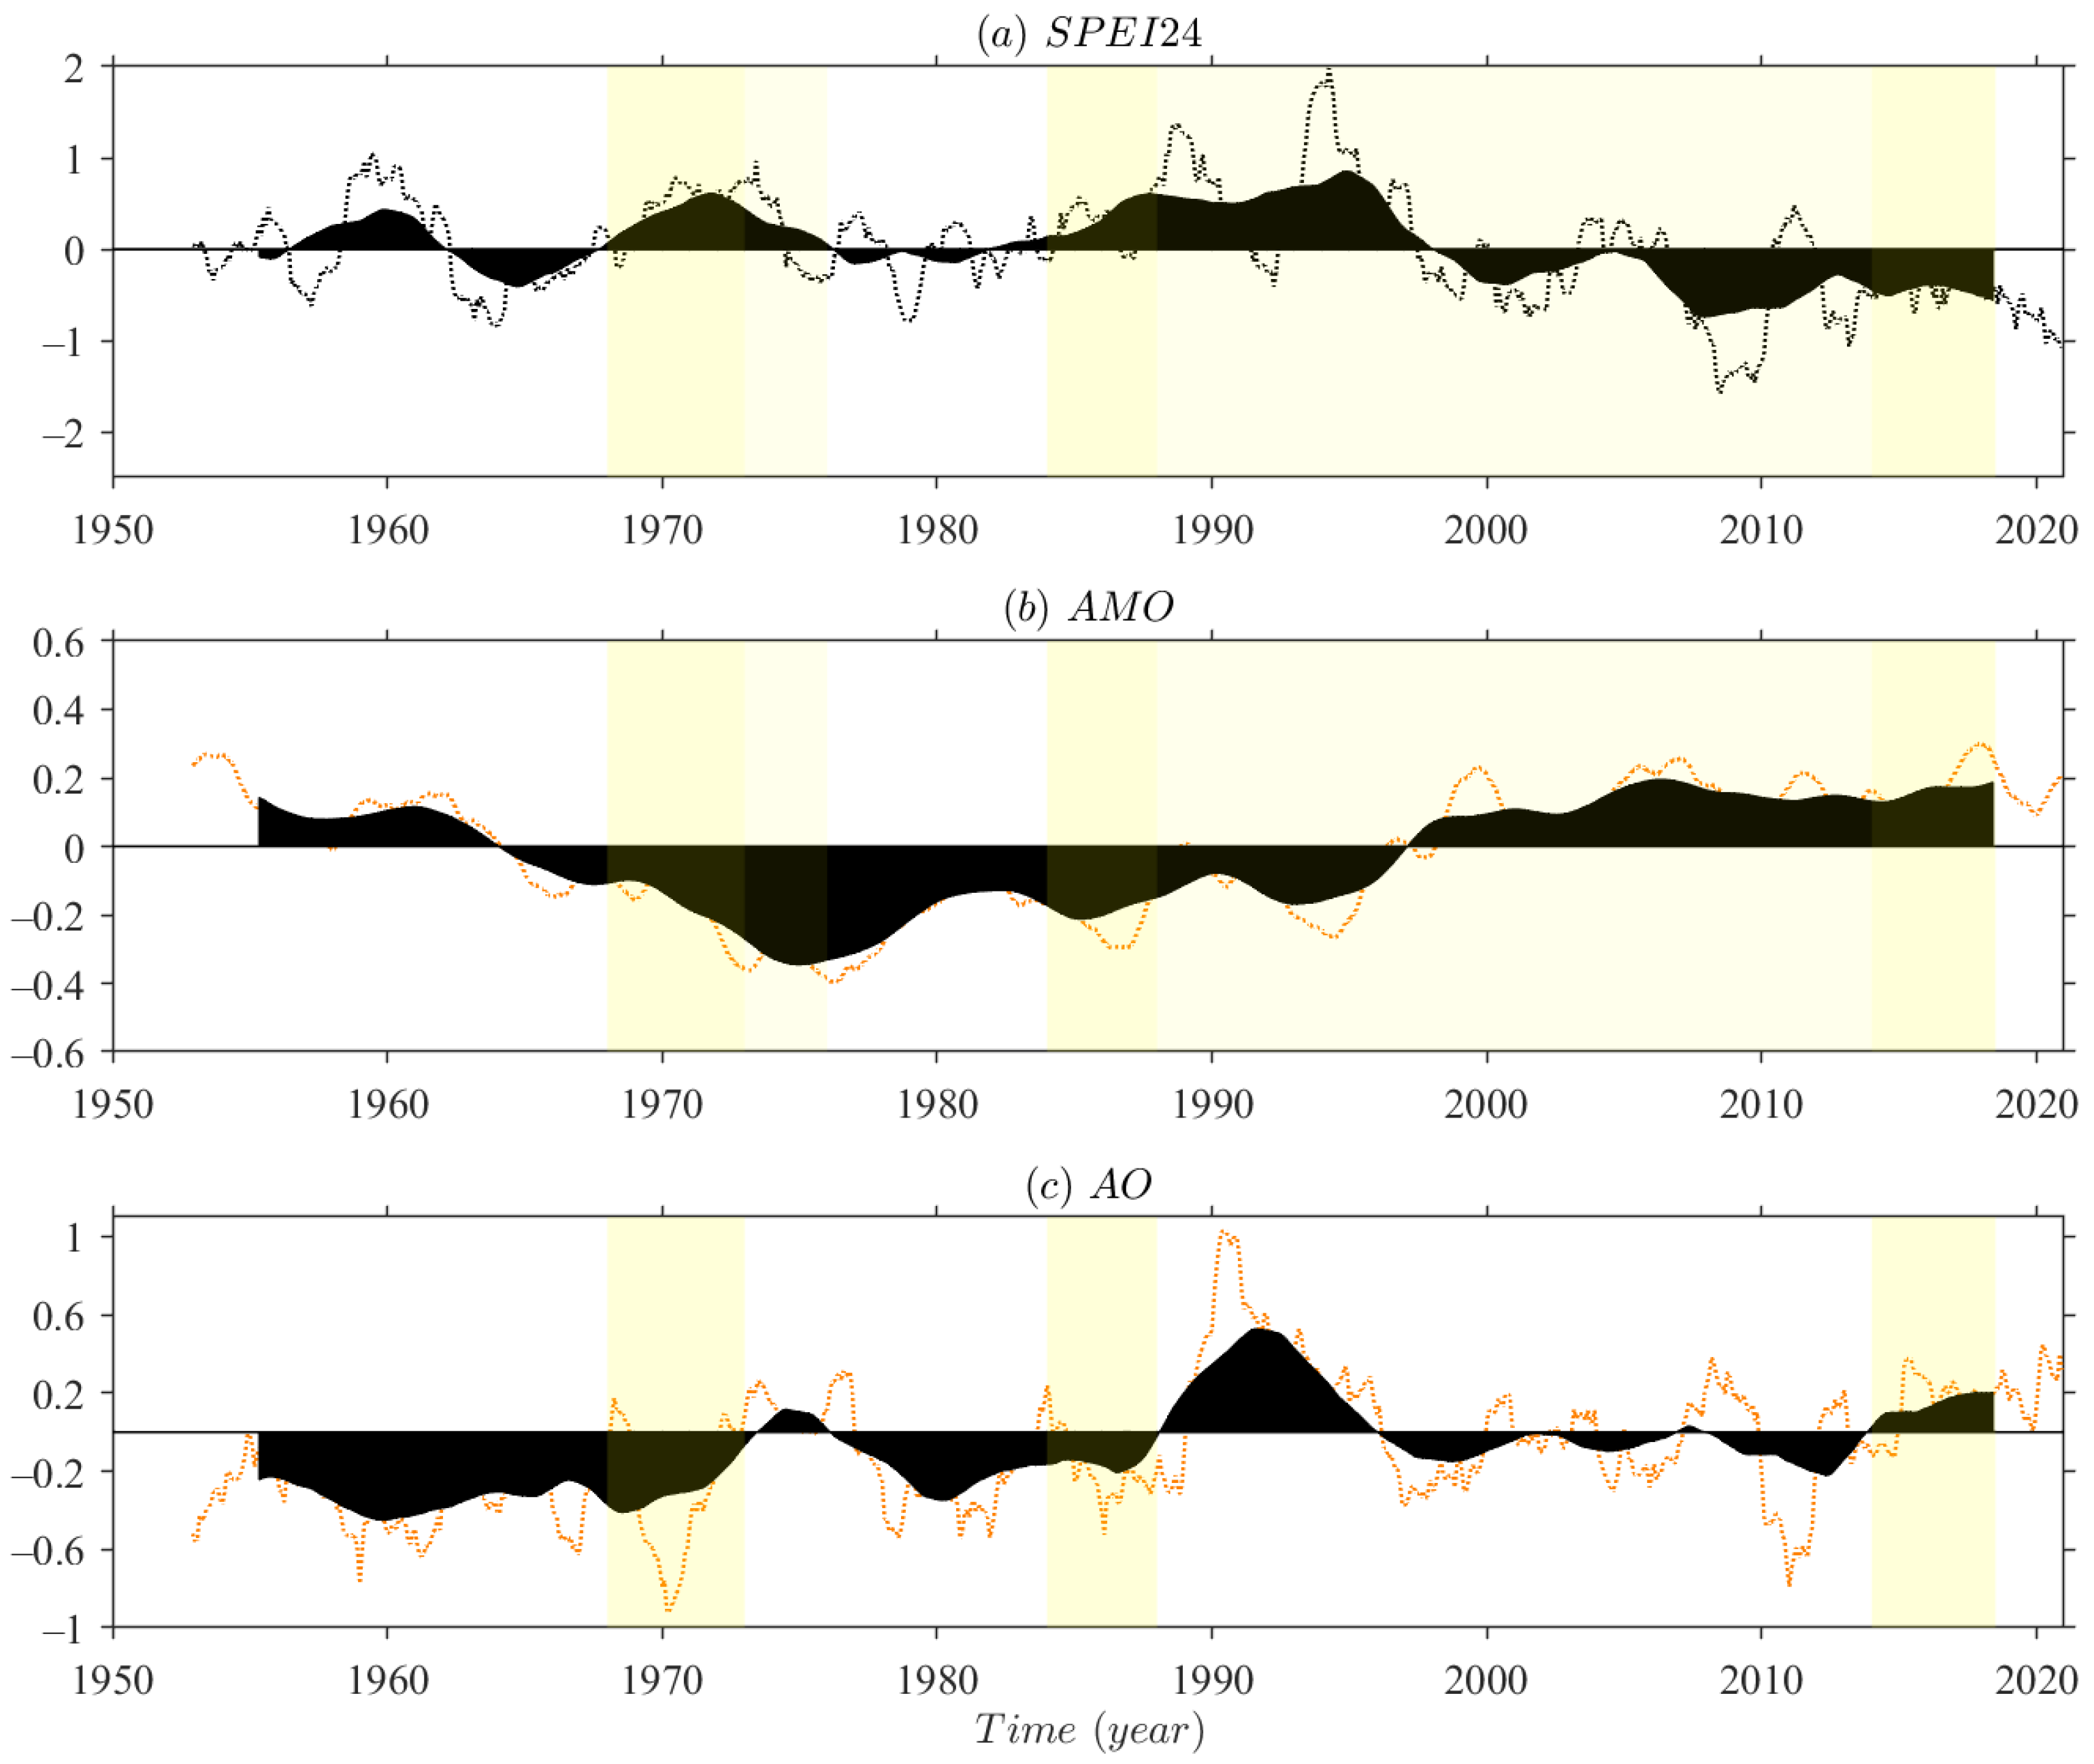
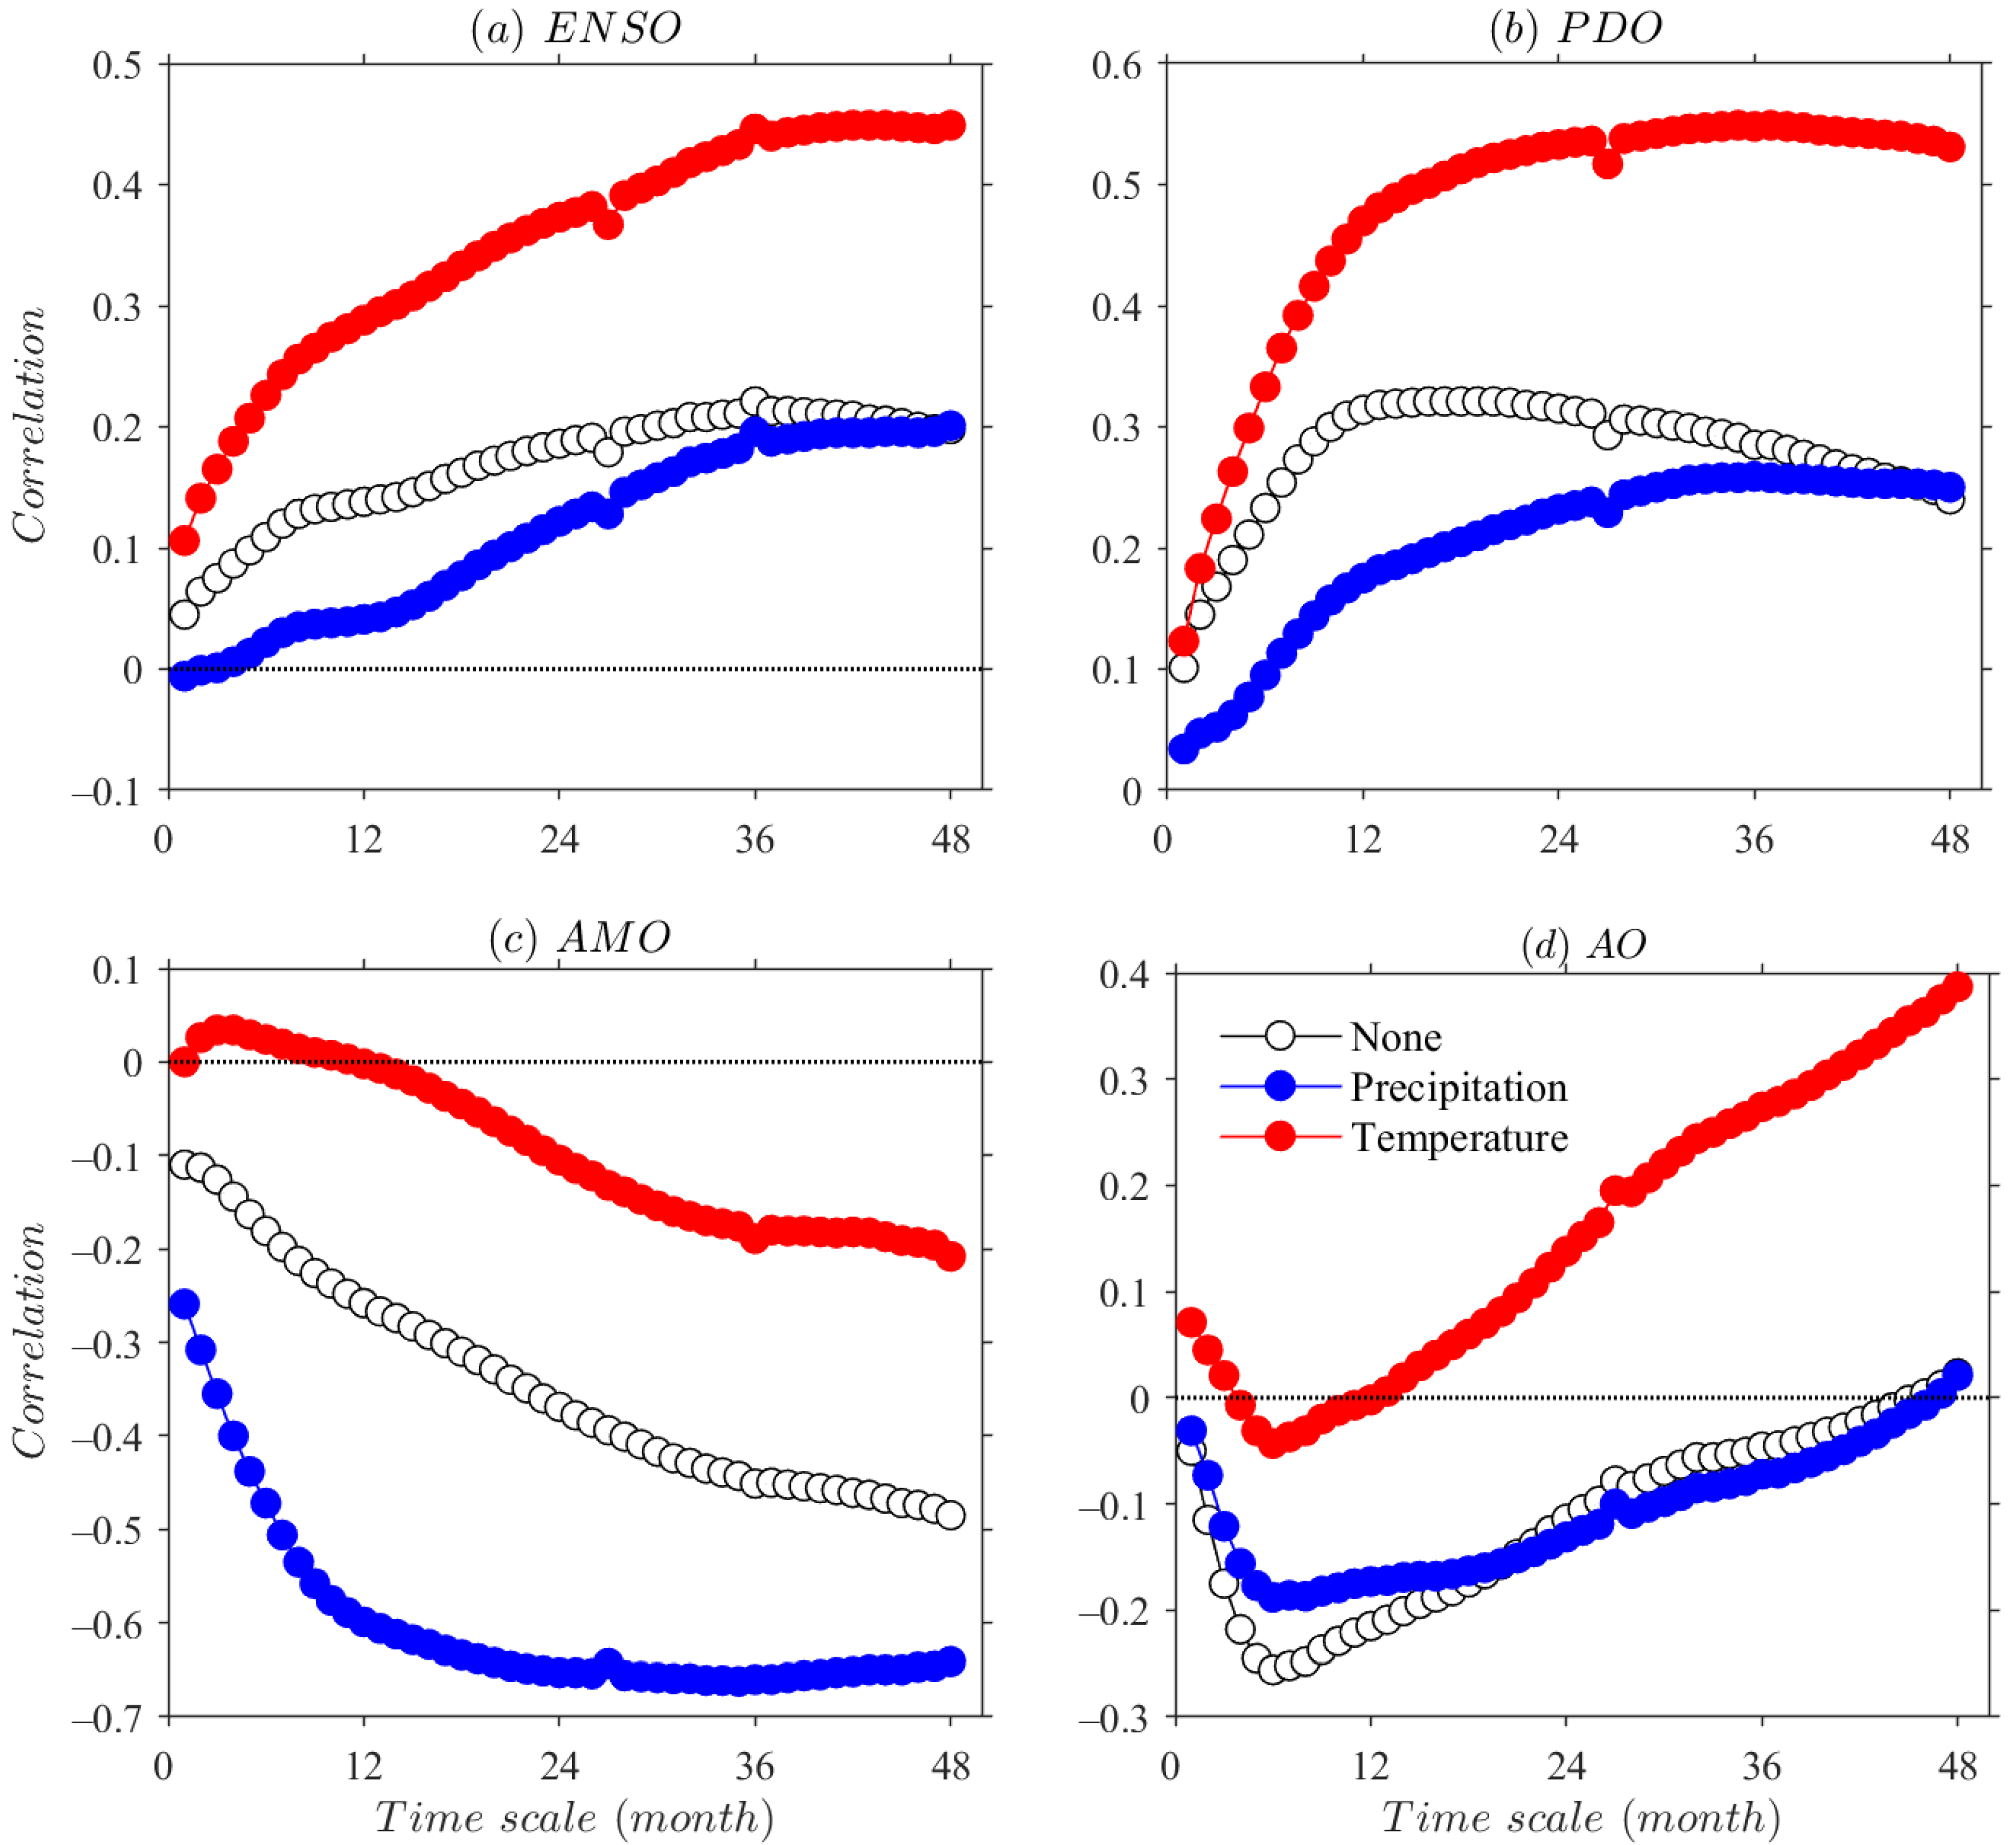
Table 1.
Test statistics of stepwise regression for SPEI-3, SPEI-6, SPEI-12, SPEI-24, SPEI-36, and SPEI-48 based on ENSO(NINO3.4), PDO, AMO, and AO indices. The significance of the t-test statistics is evaluated at 95% confidence interval. Two-tailed t-test statistics is applied, hence the computed p-value less than 0.025 indicates the significance of relationship between the SPEI and teleconnections. The higher Variance Inflation Factor (VIF) refers to the stronger the multi-collinearity is.
| SPEI | Independent | Coefficient | Std. Error | t | p | VIF |
|---|---|---|---|---|---|---|
| SPEI-3 | Constant | −0.016 | 0.02 | −0.823 | 0.411 | |
| AO | −0.14 | 0.028 | −4.973 | <0.001 | 1.034 | |
| AMO | −0.41 | 0.094 | −4.349 | <0.001 | 1.012 | |
| PDO | 0.085 | 0.02 | 4.279 | <0.001 | 1.023 | |
| SPEI-6 | Constant | −0.029 | 0.02 | −1.473 | 0.141 | |
| AO | −0.285 | 0.036 | −7.852 | <0.001 | 1.04 | |
| AMO | −0.65 | 0.097 | −6.731 | <0.001 | 1.019 | |
| PDO | 0.127 | 0.021 | 6.145 | <0.001 | 1.022 | |
| SPEI-12 | Constant | −0.034 | 0.019 | −1.795 | 0.073 | |
| PDO | 0.208 | 0.022 | 9.653 | <0.001 | 1.008 | |
| AMO | −0.927 | 0.098 | −9.45 | <0.001 | 1.019 | |
| AO | −0.329 | 0.045 | −7.31 | <0.001 | 1.027 | |
| SPEI-24 | Constant | −0.042 | 0.018 | −2.311 | 0.021 | |
| AMO | −1.271 | 0.099 | −12.878 | <0.001 | 1.012 | |
| PDO | 0.249 | 0.023 | 10.839 | <0.001 | 1.003 | |
| AO | −0.318 | 0.055 | −5.734 | <0.001 | 1.015 | |
| SPEI-36 | Constant | −0.038 | 0.018 | −2.129 | 0.034 | |
| AMO | −1.545 | 0.098 | −15.779 | <0.001 | 1.027 | |
| PDO | 0.172 | 0.033 | 5.194 | <0.001 | 1.906 | |
| AO | −0.256 | 0.062 | −4.11 | <0.001 | 1.045 | |
| ENSO | 0.208 | 0.064 | 3.251 | 0.001 | 1.875 | |
| SPEI-48 | Constant | −0.031 | 0.018 | −1.714 | 0.087 | |
| AMO | −1.677 | 0.1 | −16.747 | <0.001 | 1.034 | |
| ENSO | 0.335 | 0.079 | 4.259 | <0.001 | 1.92 | |
| PDO | 0.108 | 0.037 | 2.962 | 0.003 | 2.01 | |
| AO | −0.155 | 0.068 | −2.273 | 0.023 | 1.088 |
Table 2.
Test statistics of stepwise regression for SPEI-3, SPEI-6, SPEI-12, SPEI-24, SPEI-36, and SPEI-48 based on the optimal time-delay ENSO, PDO, AMO, and AO indices series. Lag k indicates that SPEI lags teleconnections by k months, hence lag 0 denotes the series of factors synchronized with SPEI. The significance of the t-test statistics is evaluated at 95% confidence interval. Two-tailed t-test statistics is applied, hence the computed p-value less than 0.025 indicates the significance of relationship between the SPEI and teleconnections. The higher Variance Inflation Factor (VIF) refers to the stronger the multi-collinearity is.
| SPEI | Independent | Coefficient | Std. Error | t | p | VIF |
|---|---|---|---|---|---|---|
| SPEI-3 | Constant | −0.005 | 0.02 | −0.258 | 0.796 | |
| lag17AMO | −0.459 | 0.098 | −4.684 | <0.001 | 1.103 | |
| lag1PDO | 0.109 | 0.02 | 5.46 | <0.001 | 1.078 | |
| lag0AO | −0.1 | 0.028 | −3.512 | <0.001 | 1.042 | |
| lag8ENSO | −0.074 | 0.026 | −2.835 | 0.005 | 1.143 | |
| SPEI-6 | Constant | −0.013 | 0.019 | −0.67 | 0.503 | |
| lag17AMO | −0.732 | 0.099 | −7.364 | <0.001 | 1.11 | |
| lag0PDO | 0.157 | 0.021 | 7.657 | <0.001 | 1.056 | |
| lag0AO | −0.209 | 0.036 | −5.796 | <0.001 | 1.032 | |
| lag8ENSO | −0.075 | 0.027 | −2.792 | 0.005 | 1.144 | |
| SPEI-12 | Constant | −0.014 | 0.019 | −0.76 | 0.447 | |
| lag0PDO | 0.24 | 0.021 | 11.423 | <0.001 | 1.02 | |
| lag18AMO | −1.105 | 0.096 | −11.486 | <0.001 | 1.012 | |
| lag0AO | −0.221 | 0.044 | −5.049 | <0.001 | 1.008 | |
| SPEI-24 | Constant | 0.034 | 0.018 | 1.852 | 0.064 | |
| lag0AMO | −1.172 | 0.1 | −11.779 | <0.001 | 1.024 | |
| lag0PDO | 0.181 | 0.031 | 5.899 | <0.001 | 1.802 | |
| lag22AO | 0.263 | 0.058 | 4.521 | <0.001 | 1.118 | |
| lag0ENSO | 0.094 | 0.047 | 1.992 | 0.047 | 1.684 | |
| SPEI-36 | Constant | 0.044 | 0.018 | 2.442 | 0.015 | |
| lag0AMO | −1.359 | 0.101 | −13.483 | <0.001 | 1.034 | |
| lag0PDO | 0.109 | 0.036 | 3.029 | 0.003 | 2.194 | |
| lag37AO | 0.316 | 0.067 | 4.721 | <0.001 | 1.228 | |
| lag0ENSO | 0.284 | 0.064 | 4.421 | <0.001 | 1.881 | |
| SPEI-48 | Constant | 0.064 | 0.018 | 3.535 | <0.001 | |
| lag0AMO | −1.455 | 0.101 | −14.37 | <0.001 | 1.003 | |
| lag0ENSO | 0.554 | 0.06 | 9.295 | <0.001 | 1.015 | |
| lag44AO | 0.433 | 0.065 | 6.645 | <0.001 | 1.018 |
Publisher’s Note: MDPI stays neutral with regard to jurisdictional claims in published maps and institutional affiliations. |
© 2022 by the authors. Licensee MDPI, Basel, Switzerland. This article is an open access article distributed under the terms and conditions of the Creative Commons Attribution (CC BY) license (https://creativecommons.org/licenses/by/4.0/).
Share and Cite
MDPI and ACS Style
Yang, R.; Xing, B. Teleconnections of Large-Scale Climate Patterns to Regional Drought in Mid-Latitudes: A Case Study in Xinjiang, China. Atmosphere 2022, 13, 230. https://doi.org/10.3390/atmos13020230
AMA Style
Yang R, Xing B. Teleconnections of Large-Scale Climate Patterns to Regional Drought in Mid-Latitudes: A Case Study in Xinjiang, China. Atmosphere. 2022; 13(2):230. https://doi.org/10.3390/atmos13020230
Chicago/Turabian StyleYang, Ruting, and Bing Xing. 2022. "Teleconnections of Large-Scale Climate Patterns to Regional Drought in Mid-Latitudes: A Case Study in Xinjiang, China" Atmosphere 13, no. 2: 230. https://doi.org/10.3390/atmos13020230
Note that from the first issue of 2016, this journal uses article numbers instead of page numbers. See further details here.