
Phylogenetic History and Phylogeographic Patterns of the European Wildcat (Felis silvestris) Populations

Unit for Conservation Genetics (BIO-CGE), Italian Institute for Environmental Protection and Research (ISPRA), Via Cà Fornacetta 9, 40064 Ozzano dell’Emilia, Italy
*
Author to whom correspondence should be addressed.
†
These authors contributed equally to this work.
Animals 2023, 13(5), 953; https://doi.org/10.3390/ani13050953
Submission received: 26 January 2023
/
Revised: 27 February 2023
/
Accepted: 2 March 2023
/
Published: 6 March 2023
(This article belongs to the Special Issue Seeking Efficiency in the Conservation of Wild Mammals)
Abstract
:Simple Summary
The European wildcat is an iconic small-sized predator that is still threatened by habitat fragmentation, accidental or illegal killings, and hybridization with domestic cats. However, phylogenetic and phylogeographic patterns of the taxon, though essential to design appropriate long-term conservation management actions, have been poorly investigated. Therefore, in this study, for the first time, we describe the most geographically-representative evolutionary history of the species in Europe based on mitochondrial DNA sequences. Our results clearly show that the European wildcat genetic variability was mainly originated during Pleistocene climatic oscillations and successively modeled by both historical natural gene flow among wild lineages and more recent wild x domestic anthropogenic hybridization events.
Abstract
Disentangling phylogenetic and phylogeographic patterns is fundamental to reconstruct the evolutionary histories of taxa and assess their actual conservation status. Therefore, in this study, for the first time, the most exhaustive biogeographic history of European wildcat (Felis silvestris) populations was reconstructed by typing 430 European wildcats, 213 domestic cats, and 72 putative admixed individuals, collected across the entire species’ distribution range, at a highly diagnostic portion of the mitochondrial ND5 gene. Phylogenetic and phylogeographic analyses identified two main ND5 lineages (D and W) roughly associated with domestic and wild polymorphisms. Lineage D included all domestic cats, 83.3% of putative admixed individuals, and also 41.4% of wildcats; these latter mostly showed haplotypes belonging to sub-clade Ia, that diverged about 37,700 years ago, long pre-dating any evidence for cat domestication. Lineage W included all the remaining wildcats and putative admixed individuals, spatially clustered into four main geographic groups, which started to diverge about 64,200 years ago, corresponding to (i) the isolated Scottish population, (ii) the Iberian population, (iii) a South-Eastern European cluster, and (iv) a Central European cluster. Our results suggest that the last Pleistocene glacial isolation and subsequent re-expansion from Mediterranean and extra-Mediterranean glacial refugia were pivotal drivers in shaping the extant European wildcat phylogenetic and phylogeographic patterns, which were further modeled by both historical natural gene flow among wild lineages and more recent wild x domestic anthropogenic hybridization, as confirmed by the finding of F. catus/lybica shared haplotypes. The reconstructed evolutionary histories and the wild ancestry contents detected in this study could be used to identify adequate Conservation Units within European wildcat populations and help to design appropriate long-term management actions.
1. Introduction
Biogeographic and phylogeographic patterns are key factors in clarifying the evolutionary histories of taxa and identifying appropriate conservation management units (ESU and MU [1,2]) to be long-term preserved [3,4]. Quaternary climate oscillations have significantly affected the current composition, distribution, and genetic diversity of species, subspecies, and populations, with local extinctions, replacements, and re-expansions with secondary contacts within the Palaearctic region [5]. Additionally, the current Eurasian taxa distribution and genetic structure have been further altered by more recent anthropic factors, such as natural habitat fragmentation, domestication, and alien species invasions, which are heavily impacting biodiversity and ecosystem equilibria [6,7]. The potential consequences of such past environmental changes and recent intense anthropic activities on the survival of natural taxa have been extensively investigated through a number of molecular studies, which allowed to reconstruct complex phylogeographic structures [8,9,10], identify local adaptations [11,12], trace migration routes [13,14], detect domestic or allochthonous introgression signals [15,16], and design sound conservation strategies, especially for populations affected by protracted demographic declines [17,18].
Among Eurasian felids, the European wildcat (Felis silvestris), heterogeneously distributed throughout Europe, Caucasus, and Turkey, represents a challenging conservation priority, potentially threatened by habitat loss and anthropogenic hybridization, whose taxonomy and systematics are, however, still debated [19,20,21].
Indeed, based on genetic and biogeographic information, Driscoll et al. [20] included the European wildcat among the five subspecies of Felis silvestris (F. s. silvestris, F. s. lybica, F. s. catus, F. s. ornata, and F. s. cafra). Conversely, Kitchener et al. [22] recently reclassified the European taxa as three separate species: the European wildcat, Felis silvestris, the African wildcat, Felis lybica, and the domestic cat, Felis catus.
Fossil records and archaeological remains dated the first appearance of the European wildcat in the continent back to 450,000–200,000 years ago [23]. Since then, both Pleistocene natural climatic oscillations [24,25] and anthropogenic events, such as human persecution [26], deforestation, habitat modifications, and local decline of major prey [27,28,29], have continuously shaped current distribution patterns and genetic structure of the species [25]. In particular, the European wildcat genetic structure has been further muddled by anthropogenic hybridization and subsequent introgression with domestic cats, which were human-spread from the Middle East through Europe after their domestication from the African wildcat [20,30,31].
To shed light on the conservation status of the taxon, the European wildcat population genetic structure [32,33,34] and patterns of domestic admixture [35,36,37,38,39] have been deeply addressed, principally using nuclear molecular (STR and SNP) markers, detecting five main biogeographic groups and variable degrees of domestic introgression throughout Europe [25,34,40].
However, only a few molecular studies have investigated phylogenetic and phylogeographic patterns of Felis silvestris in Europe so far, mainly using informative mitochondrial portions (such as the Control Region or the NADH Dehydrogenate Subunits) to distinguish domestic cat from European wildcat lineages, detecting the rough presence of a continental and Mediterranean clade among the latter [20,31,35,36,41,42]. However, these studies also hightailed the occurrence of anomalous cases of F. catus/lybica mitochondrial lineages among nuclear-pure wildcat individuals, which might be interpreted as (i) the legacy of ancient natural [31], (ii) Neolithic human-mediated [41] hybridization events between European and African wildcat populations, or (iii) a signal of a more recent anthropogenic admixture between European wildcats and domestic cats [20]. Nevertheless, only a small number of individuals were typed in these studies, and the analyzed samples were collected across restricted geographical areas. Thus, an extensive and exhaustive analysis of the European wildcat mitochondrial diversity patterns across the continent is still missing and would be necessary to disentangle the complex evolutionary framework of the species and better understand the role played by natural and anthropogenic drivers.
In this study, therefore, we analyzed variation patterns of a portion of the mitochondrial NADH dehydrogenase subunit 5 in a geographically representative set of European wildcat and domestic cat individuals with the scope to (1) accurately describe European wildcat phylogenetic and phylogeographic patterns in Europe, (2) date back divergence times among the main haplogroups in the European wildcat phylogenetic history, and (3) evaluate different likely biogeographic scenarios to clarify the origin of shared haplotypes between wild and domestic cats.
2. Materials and Methods
2.1. Sampling
A total of 705 high-quality DNA cat samples, opportunistically collected from found dead animals between 1998 and 2010 in 12 sub-regions belonging to six European biogeographic macro-regions (Figure 1), were selected from the ISPRA Felis DNA biobank [25]. Sampled individuals had been previously identified morphologically by collectors according to phenotype, life history traits, and biometric indices [43,44,45]. Samples had also been previously genotyped at 31 microsatellites (STR) loci [25] and genetically classified as domestic (Felis catus), wild (Felis silvestris), or putative wild x domestic admixed cats through Bayesian clustering analyses based on an assignment threshold of posterior probability proportion to belong to the wildcat cluster qi = 0.90 [33] (Supplementary Table S1). According to these criteria, the selected samples were re-classified into 420 European wildcats, 213 domestic cats, and 72 putative admixed individuals (see Mattucci et al. [25] for details about sampling, DNA extraction, genotyping, and assignment methods). Due to the high level of domestic introgression spread in Scotland and Hungary, felid samples from these two sub-regions were mainly represented by wild x domestic admixed cats [25].
2.2. Mitochondrial DNA Sequencing and Haplotype Identification
Selected samples were sequenced for a portion of 835 bp of the mitochondrial NADH dehydrogenase subunit 5 (ND5; nucleotides 13,149–13,983 mapped on the mitochondrial genome of the domestic cat; NCBI Reference Sequence NC001700). This mtDNA region is particularly suitable for phylogeny reconstructions, because of the absence of nuclear mitochondrial segments (numts) and its reduced homoplasy, and is highly discriminating, since it contains seven diagnostic mutations useful to distinguish the European wildcat (F. silvestris) from the domestic/African cat (F. catus/lybica) lineages [20,31].
Fragments were amplified using Polymerase Chain Reaction (PCR) primers F2B (5′-TGCCGCCCTACAAGCAAT-3′) and R3B (5′-TAAGAGACGTTTAATGGAGTTGAT-3′) [47]. Each 10 µL PCR reaction contained 2 µL of DNA (c. 50 ng), 0.8 µL of 10X Taq Buffer advanced (Eppendorf) with self-adjusting Mg²+ (Eppendorf), 0.80 µL of 0.2% bovine serum albumin (Sigma–Aldrich, St. Louis, MO, USA), 0.36 µL of 2.5 mM dNTPs (Eppendorf), 0.15 µL of each 10 mM primer solution (Bionordika, Solna, Sweden), 0.04 µL of 5 U/µL HotStart Taq polymerase (Eppendorf, Tokyo, Japan), and 5.70 µL of purified water (Eppendorf, Milano, Italy). PCRs were performed in a Veriti Thermal Cycler (Life Technologies, Carlsbad, CA, USA) with the following thermal profile: 94 °C for 15 min for initial denaturation and Taq activation, followed by 50 cycles of 30 s at 94 °C, 60 s at 55 °C and 60 s at 72 °C. The PCR cycling was followed by a final extension for 10 min at 72 °C. PCR products were stored at 4 °C and then purified by exonuclease digestions (1 µL of EXO-SAP per sample, incubated at 37 °C for 30 min, then at 80 °C for 15 min). The purified amplicons were Sanger-sequenced in both directions. Each 10 µL reaction contained 1 µL of amplified DNA, 1 µL of BigDye v1.1 (Life Technologies), 0.2 µL of either the forward or reverse primer, and 7.8 µL of purified water. Sequencing was performed in a Veriti Thermal Cycler with 25 cycles of 10 s at 96 °C, 5 s at 55 °C, 4 min at 60 °C and storage at 4 °C. The purified products were added with 10 µL of Hi-DI formamide (Life Technologies), denatured for 3 min at 95 °C, and analyzed on an Applied Biosystems (ABI) 3130 XL DNA Analyzer.
2.3. Phylogenetic Analyses and Estimates of Divergence Times
The 705 cat NAD5 sequences were aligned and corrected in SeqScape v2.5 (Life Technologies) and used to build a cat NAD5 dataset, which also included other 10 different European wildcat homologous sequences (accession numbers: EF587158, EF587164, EF587168, EF587166, EF587170, EF587169, EF587171, EF587156, EF587162, EF587159; [20]), retrieved from GenBank.
All the 715 produced and downloaded cat sequences were consequently trimmed into equal sequences of 669 bp (positions 13,243–13,911) to maintain full-length, double-stranded, high-quality sequence data across all samples, using BioEdit v7.1.11 [48].
Identical haplotypes were identified and collapsed using DnaSP v5.10.01 [49], and possible correspondences with haplotypes already published in GenBank were checked using Blast [50]. The final dataset of unique cat NAD5 haplotypes was then used to perform all the downstream diversity, phylogeographic and phylogenetic analyses.
Haplotype (Hd) and nucleotide diversity (π) were computed using DnaSP.
The best nucleotide substitution model scheme was computed in PartitionFinder v2 [51] by the Bayesian information criterion (BIC), and, subsequently, three phylogenetic trees were constructed through different computational approaches: (i) the neighbor-joining (NJ, [52]) method, using Smart Model Selection (SMS, [53]) algorithms implemented in Mega v11.0 [54] and performing 10,000 random bootstrap replications; (ii) the maximum-likelihood method (ML, [55]) implemented in Phyml v3.0 [56] with the heuristic search by topological rearrangement of an initial tree (Near-Neighbor-Interchange) and 5000 random bootstrap replications; (iii) the Bayesian method (BT) implemented in Beast v2.1.3 [57], which further allowed to estimate divergence times among nodes. Due to the strong relationship between taxa, a strict molecular clock model with a fixed mean substitution rate (2.28 × 10⁻⁸/site/year [47]) and constant population size as coalescent priors were selected. The Bayesian posterior probabilities (BPPs), as well as the high posterior densities for the node ages (HPDs), were extrapolated by performing three independent MCMC runs of 100,000,000 steps with a burn-in period of 10,000,000 steps and picking genealogies every 2000 steps. The results of the three chains were simultaneously analyzed in Tracer v1.7 [58].
The corresponding portion of the ND5 sequence of Felis margarita retrieved from GeneBank (Accession number: EF587034) was used as an outgroup in NJ and ML tree reconstructions. Conversely, the BT tree was calculated without the inclusion of an outgroup, as suggested by Beast developers [57], and the tree rooting point was estimated using as a prior calibration point the time interval in which the common ancestor between F. silvestris and F. catus/lybica likely coalesced (230,000–173,000 years ago [20]).
Each supported node was annotated with bootstrap values for NJ and ML trees and the highest posterior density (HPD) for the BT tree (e.g.: NJ/ML/HPD).
2.4. Demographic Analyses
A median-joining (MJ) network analysis was performed in Network v4.6 (Fluxus Technology Ltd., Stanway, UK [59]) to corroborate tree reconstructions, and investigate haplotypes relationships, frequencies, and geographic repartitions, using an ε = 10 and transversions/transition weighting of 3:1.
Haplotype pairwise genetic distances among cat taxa and cat biogeographic clusters, assessed with an analysis of molecular variance (AMOVA), and the ϕST and ϕSC indexes for genetic differentiation [60], were computed in Arlequin v3.5.1.3 [61], running 10,000 permutations to evaluate the significance of each parameter.
Further spatial analysis of molecular variance (SAMOVA) was performed using Samova v2.0 [62], which defines clusters of geographically homogeneous populations, based on an a priori definition of the number of K groups, and uses a simulated annealing procedure to maximize the proportion of total genetic variance between groups with an AMOVA approach. We tested a different number of groups (with K from 2 to 9), each time with the simulated annealing process repeated 10,000 times, starting with a different partition of the population samples into the K groups. The selection of the best K-repartitions was based on the highest significant values of the FCT genetic differentiation index. FCT estimates differentiation among those groups of populations. The closer FCT is to 1, the more divergent the groups are from each other.
2.5. Approximate Bayesian Computation Analyses
The Approximate Bayesian Computation (ABC) simulations [63], implemented in Diyabc v2.1.0 [64], were run to model plausible demographic scenarios and estimate divergence times (in generations). We performed two types of ABC analyses: (a) considering only populations carrying wildcat mitochondrial haplotypes [20]; and (b) considering populations showing mito-nuclear discordance (see Results). In details, to avoid over-computation, we designed the smallest number of evolutionary scenarios using as prior populations the spatially geographical and genetically homogeneous clusters found through SAMOVA analyses. Successively, we simulated alternative evolutionary hypotheses using haplotype distribution and divergence times estimated from the reconstructed Bayesian phylogeny (see Results) and modeled population dynamics, taking into account the main phylogeographic findings reported in the literature [20,25,31]. Therefore, we tested four demographic scenarios for the wildcat haplotypes (Supplementary Figure S1), hypothesizing that the four clusters split sequentially (scenarios 1 and 3) or simultaneously (scenarios 2 and 4) and that Cluster 4 diverged by isolation (scenarios 1 and 2) or followed a gene flow with other European populations (scenarios 3 and 4). The haplogroup, including wildcats showing mito-nuclear discordances, was analyzed by testing three different scenarios: (a) the three clusters split in recent times from few common ancestral haplotypes (scenario 1); (b) the three clusters split in different sequential evolutionary events (scenario 2); (c) same as scenario 2 but considering longer coalescence time (scenario 3). We ran 4 × 10⁶ simulations for each scenario using prior uniform distributions of the effective population sizes and time parameters with the gamma-distributed mutation model with Gamma shape = 4.0. Scenarios were compared by estimating posterior probabilities using the logistic regression method using 1% of the simulated datasets. For the best models, posterior distributions of the parameters were estimated with a logit-transformed linear regression on the 1% simulated datasets closest to the observed data. Scenario confidence was evaluated by comparing observed and simulated summary statistics. Finally, the goodness-of-fit of the posterior parameters for the best-performing scenarios was tested via the model checking option with default settings, and significance was assessed after Bonferroni correction for multiple testing.
3. Results
Haplotype alignment did not show any indels or stop codons and the aminoacidic sequence was concordant with the domestic cat ND5 protein sequence (NCBI Reference Sequence NC001700). Thus, we excluded the amplification of numts or pseudogenes. After regrouping procedures, we identified 29 haplotypes among the 715 sequences, counting 32 polymorphic sites, including 23 parsimony informative sites, with a total haplotype diversity Hd = 0.862 ± 0.006 and a nucleotide diversity π = 0.870 ± 0.013 (Table 1). We compared the resulting haplotype sequences with the NCBI nucleotide database using the Blast algorithm founding 12 new unpublished haplotypes (Supplementary Table S2).
3.1. Phylogenetic Analyses and Divergence Time Estimates
The best fit evolutionary model for the 29-haplotype alignment was Kimura’s two-parameter (K80 [65]) model with invariable sites (I = 0.80) for the first and second codon positions, whereas the Hasegawa, Kishino, and Yano (HKY [66]) model with a gamma distribution and four discrete categories was selected for the third codon position.
The NJ, ML, and BT phylogenetic trees showed very concordant topologies for the main clades (Supplementary Figure S2); thus, we described in detail directly the topology of the tree generated by Beast, which presented posterior probabilities of the main internodes > 0.90 (Figure 2a). In the BT tree, haplotypes were clearly split into two main and strongly supported lineages (node 1, 100/100/1), diverging 197,500 years ago (95% HPD 173,002–226,274 years ago): (i) lineage D, including 15 haplotypes, shared in 448 (62.3%) individuals and (ii) lineage W, including 14 haplotypes, shared in 267 individuals (37.7%) (Table 1). Haplotypes were separated into three main categories according to the previous 31-STR Bayesian assignment tests performed by Mattucci et al. [25]: (i) category “d” included haplotypes found only among domestic cats; (ii) category “dw” included haplotypes found either in domestic, wild or putative admixed individuals; and iii) category “w” included haplotypes found only among wildcats and putative admixed individuals.
Lineage D included eight haplotypes, identified by the prefix “d”, exclusively detected in 25 domestic cat genotypes, and other seven haplotypes, identified by the prefix “dw”, found in 174 wildcat (41.4% of the wild), 188 domestic cats, and 61 putative admixed (84.7% of the wild) genotypes (Supplementary Table S3). In this lineage, we found the first highly supported split (node 2, 100/88/0.99) dating back about 80,000 years ago (95% HPD 31,561–145,850 years ago), distinguishing two major clade groups, I-II and III (Figure 2a). A second split occurred at node 3 (63/65/0.54), about 50,000 years ago (95% HPD 16,756–97,189 years ago), separating clades I and II (Figure 2a). A final third split appeared at node 4 (61/64/0.92), dating back 37,700 years ago (95% HPD 11,992–76,931 years ago) and dividing sub-clades Ia and Ib (Figure 2a). Interestingly, most wild individuals showing discordant mtDNA variants (130 wildcats) shared dw4 and dw6 haplotypes within sub-clade Ia, and all 61 putative admixed individuals carried dw haplotypes.
Lineage W included 14 haplotypes, identified by the prefix “w”, and shared by 246 (58.6%) wildcats, 11 (15.3%) putative admixed individuals, and all the 10 GeneBank European wildcat reference sequences. It presented only one main supported diverging point (node 5, 96/100/1), dated back to 62,400 years ago (95% HPD 21,860–118,910 years ago), separating two clades, IV and V (Figure 2a) (see Supplementary Material and Supplementary Table S3 for details).
3.2. Phylogeographic Analyses of European Wildcat and Putative Admixed Individuals
MJ network, reconstructed using the entire 29-haplotype alignment, was highly concordant with the topology of the BT tree (Figure 2), identifying two main haplogroups (D and W), which were clearly separated by seven diagnostic polymorphisms, previously described by Driscoll et al. [47], though one of them (D) included seven domestic–wild shared haplotypes (Figure 2b). The AMOVA (Table 2), performed considering European wildcats, domestic cats, and putative admixed cats as different groups, detected a higher proportion of variation within (63.3%) than among (36.7%) populations and a significant differentiation index ϕst = 0.37 (p < 0.01). However, to avoid that domestic cat distribution, strongly linked to human activities, might inflate estimates, the initial dataset was pruned from samples genetically assigned to the domestic cat group and phylogeographic analyses were focused on wildcat and putative admixed populations. Thus, a further MJ network was reconstructed using ND5 sequences from 430 wildcats and 72 putative admixed individuals, corresponding to 21 haplotypes and characterized by 26 polymorphic sites and 21 parsimony informative sites (Figure 2c). In the network, the presence of two main haplogroups, significantly differentiated (ϕST = 0.97, p < 0.01; Table 2) was still evident: (i) DW, cleaned from “d” haplotypes, including 174 wildcats and 61 putative admixed cats; and (ii) W, including 256 wildcats and 11 putative admixed individuals (Figure 2c).
Haplogroup DW showed a split, roughly corresponding to node 2 of the BT tree (Figure 2c), which separated clades I-II and III. In particular, sub-clade Ia included haplotype dw4, which was the most frequent within haplogroup DW, was found in 146 individuals, and showed a spread distribution across central and southern Europe (Figure 3).
Haplogroup W showed a split, roughly corresponding to node 5 of the BT tree (Figure 2c), which separated a clade IV, shared among 85 individuals, most of them collected in Italy (63.2%) and the Iberian peninsula (18.2%) macro-regions and a clade V, shared among 182 individuals, mostly collected in Central Europe (62.6%), and in the Balkan (23%) macro-regions (Figure 2c) (see Supplementary Material and Supplementary Table S3 for details).
The spatial analysis of molecular variance (SAMOVA) showed that the most statistically-supported geographic partition within haplogroup W corresponded to K = 4 population groups, with an overall FCT = 0.64 (p < 0.01) and 63.2% of variation explained among the detected repartitions. The four groups included Italy and South-Eastern Europe (Cluster 1), Central and North-Eastern Europe, the Balkans (Cluster 2), Scotland (Cluster 3), and the Iberian Peninsula (Cluster 4) (Figure 3).
Conversely, haplogroup DW was optimally structured in K = 3 clusters, including Scotland (Cluster 1), the Iberian Peninsula (Cluster 2), and the remaining European populations (Cluster 3) (Figure 3), with a lower overall FCT = 0.28 (p < 0.05) and most of the variation explained within populations (63.06%).
The independent AMOVAs performed considering six biogeographic repartitions ([25]; Figure 1), yielded concordant results but with a slightly lower proportion of variation explained among macro-regions (58.24%) for the haplogroup W and a higher proportion of variance within populations (82.8%) in haplogroup DW (Table 2).
3.3. Demographic Analyses
A weak significant sign of population expansion was detected in the domestic cats of lineage D with a near bell-shaped curve in the mismatch plot (Figure 4), a Tajima’s D = −0.413 (p = 0.078) and a Fu and Li’s F = −2.337 (p < 0.05) (Table 2). The mismatch distribution curve (Figure 4) and the slightly significant negative values of Tajima’s and Fu and Li’s estimators suggested a low degree of population expansion also for lineage W (Table 1). However, within this haplogroup, only Italy and the Balkan macro-regions presented an increasing trend in the mismatch plot consistent with significant negative values of Tajima and Fu and Li’s statistics (Table 1, Figure 4), although these values were lower than two, suggesting caution in considering a hypothesis of actual expansion [67]. Among dw haplotypes, only those of Central Europe showed traces of an actual expansion trend with significant negative values of the statistics (Tajima’s D = −2.002; p < 0.01 and FU and Li’s F = −1.106; p < 0.05; Table 1) and a low peak in the mismatch plot (Figure 4).
3.4. Approximate Bayesian Computation Analyses
ABC simulations for haplogroup W provided the best support for scenario 4 (simultaneous population splitting with the following gene flow, Figure 5a) with a posterior probability of 0.372 (95% C.I. 0.000–0.796). Under this scenario, the median values of the divergence time showed that Cluster 1, Cluster 2, and Cluster 3 started isolating about 40,800 generations ago (5–95% quartile: 13,900–53,600). Considering a wildcat generation time of two years [16], the time from the most recent common ancestor (TMRCA) of these populations was estimated at about 81,600 years ago (5–95% quartile: 27,800–107,200 years ago). The following admixture event between Cluster 1 and Cluster 2 contributed to generating Cluster 4 approximately 8920 years ago. Simulations on the DW haplotype (Figure 5b) showed the best posterior probability for scenario 1 (simultaneous splitting in recent times) with a posterior probability of 0.748 (95% C.I. 0.367–1.000). Median values of the divergence time from TMRCA suggested 540 generations ago (5–95% quartile: 42.2–5250), corresponding to about 1080 years ago (5–95% quartile: 84.4–10,500).
4. Discussion
Pleistocene climate oscillations significantly shaped the biogeographic patterns and genetic structure of many mammal species within the Palaearctic region [5]. Several examples of shifts in the distribution and genetic composition of mammal populations following glacial and sea-level cycles have been clearly described, highlighting how recurring east–west colonization waves introduced new genetic variants, and subsequent post-glacial recolonizations from Mediterranean and extra-Mediterranean refugia further modified their genetic makeup [5,10,68,69,70]. In addition, for some species affected by anthropogenic hybridization, such as the European wildcat (Felis silvestris), the wolf (Canis lupus), or the wild boar (Sus scrofa), the genetic mosaic has been further altered by the introgression of domestic variants [31,71,72]. Therefore, here we describe phylogenetic and phylogeographic patterns obtained by analyzing a diagnostic fragment of the mtDNA on a wide sampling of European wildcats collected across Europe to (i) detect clear signs of genetic differentiation between central and southern European wildcat populations, likely resulting from glacial isolation and consequent post-glacial recolonization processes, and (ii) disentangle the origin of shared haplotypes between wild and domestic cats.
4.1. Phylogenetic Patterns
Although based on partial ND5 sequences, our phylogenetic reconstructions on European wild and domestic cats well reflected their evolutionary relationships confirming previous studies on larger portions of the mitochondrial DNA [20,31,73], as well as entire mitogenomes [74]. Indeed, we detected four main F. catus/lybica haplogroups (D: Ia, Ib, II, and III), showing an overall high level of haplotype diversity (0.735 ± 0.018) and originating about 80,000 years ago. According to Driscoll et al. [20], such clades might reflect the multiple origins of the F. catus/lybica lineage, whose estimated coalescence time, although older, is largely included within our confidential intervals. Whitin F. catus/lybica lineage, clades I and II showed a higher haplotype richness and frequency among samples (in particular, they included 58.2% of all domestic cats). Such haplogroups could be roughly associated with lineages A/B, previously found by Driscoll et al. [20] and Ottoni et al. [31], which represent the Near Eastern Felis contribution to the mtDNA pool of present-day domestic cats. On the other hand, clade III, showing a basal phyletic position, might correspond to lineage C described by Driscoll et al. [20] and Ottoni et al. [31], which includes north African wildcat haplotypes (possibly of ancient Egypt derivation) later spread in Europe [31].
Concordant results with previous studies [20,31,73] were further found for the F. silvestris lineage W, which showed two main clades, IV and V, dating back about 62,400 years ago. Similar divergent times and phylogenetic patterns have been observed also in other species, such as the pine marten (Martes martes) [69] and the wolf (Canis lupus) [75] and might be the result of Pleistocene climatic oscillations on mammal population distribution and evolution [5,69,75,76].
4.2. Phylogeographic Patterns
A spatial analysis of molecular variance (SAMOVA) was performed to clarify phylogeographic patterns within the European wildcat lineage W, showing that its haplotypes were spatially clustered into at least four main geographic groups roughly concordant with the biogeographic regions previously detected analyzing nuclear markers [25,38]: (1) a South-Eastern European cluster, spanning from Italy to Hungary; (2) a Central European cluster, spanning from the Italian and Balkan Alps to Germany; (3) a cluster including the isolated Scottish population; 4) a cluster including the Iberian population. In particular, Cluster 1 showed the overall lowest genetic variability. However, further analyses, including additional wildcat samples from other unsampled and formerly in contact with eastern Countries, such as Anatolia, might reveal increased genetic variability levels and shed light on the possible contributions of such populations in shaping the current European wildcat evolutionary history in eastern European populations, such as that living in Hungary. This cluster was mainly represented in clade IV with (a) the dominant haplotype w1, shared at low frequencies also with the Iberian Peninsula wildcats, which could be the result of a colonization wave from eastern Europe during glacial periods and subsequent isolation south of the Alps, which acted as a natural barrier to gene flow [23,25,77], and (b) the presence of a private haplotype w5 in Sicily, that could result from the long-lasting isolation of the Island from the Peninsula [78]. These recolonization and subsequent isolation patterns are further confirmed by the presence of shared mtDNA haplotypes in other mammal species, such as the pine marten (Martes martes) [69], the red deer (Cervus elaphus) [79], the roe deer (Capreolus capreolus) [5], and the brown bear (Ursus arctos) [80] in southern Europe.
Cluster 2 showed a higher genetic variability, and was mainly represented in clade V, characterized by the predominance of haplotype w4, which might have originated in extra-Mediterranean or in the Dinaric–Alpine refugia and successively widespread in Central Europe, as hypothesized through molecular studies carried out also on the hedgehog (Erinaceus europaeus) [81], the Eurasian lynx (Lynx lynx) [82] and the red deer (Cervus elaphus) [9] and confirmed by the absence of Pleniglacial wildcat archaeological findings [23].
Cluster 3 showed a single unique haplotype w3, which might be the legacy of the mtDNA gene pool of a continental wild ancestor which migrated to Britain via land bridge approximately 10,000 years ago [83] and originated the Island population, which successively experienced recurrent bottlenecks during glacial maximums, more recent demographic declines, and a compromising anthropogenic admixture with domestic cats [84]. Finally, Cluster 4 showed a) the balanced presence of haplogroups IV and V, which might derive from the Pleistocene population migration waves from Central Europe, as supported also by ABC analyses, and b) the occurrence of three private haplotypes, w9 and w12 in Spain and w8 in Portugal, which might have originated during the subsequent isolation south of the Pyrenes [85,86].
4.3. Mito-Nuclear Discordance and Evolutionary Hypotheses
Our phylogenetic and phylogeographic history of the European wildcat assessed by partial mitochondrial sequences revealed the widespread presence of haplotypes shared between wild and domestic cat populations. Indeed, a consistent proportion of individuals previously assigned to the wildcat population through STR Bayesian clustering analyses [25] were included in the mitochondrial lineage D. Cases of Felis mito-nuclear discordances have been already described and generally attributed to recent F. catus mitochondrial introgressions, which may have likely eroded domestic ancestry at the nuclear loci after a few backcrossing generations [87], leaving exogenous traces only at the mtDNA or at a small portion of the nuclear genome [16]. Accordingly, our mtDNA data showed several shared haplotypes (dw1, dw2, dw3, dw5, dw7), mostly frequent within domestic cats, which seem to have recently differentiated and simultaneously split about 1000 years ago, as further revealed by the best ABC evolutionary scenario, supporting the hypothesis of an F. catus introgression.
However, other two shared haplotypes, belonging to the D subclade Ia (dw4 and dw6), mostly frequent within wildcats, seem to have originated about 37,000 years ago, which, according to the last available archaeological and genetic findings, long pre-dated any evidence for cat domestication [20,30,88], thus suggesting their possible natural F. lybica derivation. This latter hypothesis fits well with the scenario of a late Pleistocene European wildcat migration toward the Levant and Anatolia regions already occupied by F. lybica populations [89,90]. Such a syntopic event might have promoted a natural inter-taxon gene flow introgressing F. lybica mitochondrial signatures in some European wildcat individuals [31].
A possible female-biased directionality of the admixture patterns might justify the high numbers of F. catus/lybica mtDNA hyplotypes found in the European wildcats analyzed in this study, though this hypothesis should be confirmed or denied by further Y-chromosome haplotype analyses.
5. Conclusions
In this study, using a short but highly diagnostic portion of the mtDNA, we provide the first exhaustive description of the European wildcat phylogenetic and phylogeographic structure across the entire species’ range in the continent. Our results suggest the presence of at least three main continental biogeographic clusters, roughly corresponding to the Iberian Peninsula, the South-Eastern European Mainland, and Central Europe, whose origin fits well with a model of species glacial isolation and post-glacial re-expansion from the Mediterranean and extra-Mediterranean refugia during the late Pleistocene. As expected, a fourth biogeographic cluster was identified in the isolated and almost genetically compromised Scotland wildcat population [84], which showed unique wild and domestic haplotypes. Based on their wild ancestry content, such biogeographic clusters could be used to identify four possible preliminary corresponding Conservation Units (CU, [91]) to be treated as different management priorities and preserved through well-planned conservation actions, depending on their wild genomic mito-nuclear concordance. Interestingly, our data also show the presence of mtDNA haplotypes shared between wild and domestic cat populations, likely resulting from two different independent evolutionary processes, historical natural gene flow among wild lineages, and recent wild x domestic anthropogenic hybridization. Future studies, based on the analyses of entire mitogenomes and whole nuclear genomes of early domesticated cats from museum collections, modern and ancient European and African wildcats collected also in their overlapping distribution ranges (from Turkey to the Near East), could undoubtedly help researchers to disentangle this complex biogeographic mosaic, clarify the evolutionary histories and admixture patterns, as well as shed light on the origin of the current mito-nuclear variability of the European wildcat populations and their long-term adaptive potential.
Supplementary Materials
The following supporting information can be downloaded at: https://www.mdpi.com/article/10.3390/ani13050953/s1; Results from Phylogenetic and Phylogeographic Analyses; Figure S1: ABC simulated evolutionary scenarios; Figure S2: Neighbor-joining and maximum-likelihood topology trees; Table S1: Sample database; Table S2: NAD5 haplotype sequences; Table S3: NAD5 haplotype frequencies.
Author Contributions
Conception and planning: E.V., R.C. and F.M.; Genetic analysis: E.V. and F.M.; Statistical analyses: E.V. and F.M.; Writing—Original Draft Preparation: E.V., R.C. and F.M.; Writing—Review and Editing E.V., R.C. and F.M. All authors have read and agreed to the published version of the manuscript.
Funding
This research received no external funding.
Institutional Review Board Statement
Not applicable.
Informed Consent Statement
Not applicable.
Data Availability Statement
Data presented in this study are available on request.
Acknowledgments
We thank all the colleagues who contributed over different years and numerous projects to collect the felid biological samples and who gave invaluable advice and support, in particular: Álvares F., Alves P.C., Böhle R., Bologna M.A., Delogu M., Duperòn E., De Faveri A., Fabbri E., Giuliani A., Godinho R., Herrmann M., Hupe K., Knauze D., Lapini L., Liberek M., López Bao J.V., Lucchesi M., Malsaña M., Meleòn M., Moes M., Mucci N., Oliveira R., Potocnik H., Randi E., Ribeiro A., Romy M.P., Ruiz-González A., Sforzi A., Suchentrunk F., Tedaldi G., Vercillo F., Zsolt B. We are also indebted to Selvatici M.A., Cazzato M., Dotti R., and Morreale E. (ISPRA) for their precious support with the administrative practices needed for the publication of the manuscript. We also thank the Academic Editor and two anonymous referees for providing a straightforward revision process and helpful suggestions. We are infinitely grateful to Ragni B., who spent most of his life studying the European wildcat ssp in Italy, collecting a large part of the samples analyzed in this work; thus, we would like to dedicate this paper to his memory.
Conflicts of Interest
The authors declare no conflict of interest.
References
- Moritz, C. Strategies to Protect Biological Diversity and the Evolutionary Processes That Sustain It. Syst. Biol. 2002, 51, 238–254. [Google Scholar] [CrossRef]
- Funk, W.C.; McKay, J.K.; Hohenlohe, P.A.; Allendorf, F.W. Harnessing Genomics for Delineating Conservation Units. Trends Ecol. Evol. 2012, 27, 489–496. [Google Scholar] [CrossRef] [PubMed] [Green Version]
- Frankham, R.; Ballou, J.D.; Briscoe, D.A.; McInnes, K. Genetics and the management of wild populations. In Introduction to Conservation Genetics, 2nd ed.; Frankham, R., Ballou, J.D., Briscoe, D.A., Eds.; Cambridge University Press: Cambridge, UK, 2002; ISBN 9780521702713. [Google Scholar]
- Hohenlohe, P.A.; Funk, W.C.; Rajora, O.P. Population Genomics for Wildlife Conservation and Management. Mol. Ecol. 2020, 30, 62–82. [Google Scholar] [CrossRef] [PubMed]
- Plis, K.; Niedziałkowska, M.; Borowik, T.; Lang, J.; Heddergott, M.; Tiainen, J.; Bunevich, A.; Šprem, N.; Paule, L.; Danilkin, A.; et al. Pan-European Phylogeography of the European Roe Deer (Capreolus capreolus). Ecol. Evol. 2022, 12, e8931. [Google Scholar] [CrossRef]
- Santos, A.M.C.; Cianciaruso, M.V.; Barbosa, A.M.; Bini, L.M.; Diniz-Filho, J.A.F.; Faleiro, F.V.; Gouveia, S.F.; Loyola, R.; Medina, N.G.; Rangel, T.F.; et al. Current Climate, but Also Long-Term Climate Changes and Human Impacts, Determine the Geographic Distribution of European Mammal Diversity. Glob. Ecol. Biogeogr. 2020, 29, 1758–1769. [Google Scholar] [CrossRef]
- Tedeschi, L.; Biancolini, D.; Capinha, C.; Rondinini, C.; Essl, F. Introduction, Spread, and Impacts of Invasive Alien Mammal Species in Europe. Mamm. Rev. 2022, 52, 252–266. [Google Scholar] [CrossRef] [PubMed]
- Kumar, R.; Kumar, V. A Review of Phylogeography: Biotic and Abiotic Factors. Geol. Ecol. Landsc. 2018, 2, 268–274. [Google Scholar] [CrossRef] [Green Version]
- Doan, K.; Niedziałkowska, M.; Stefaniak, K.; Sykut, M.; Jędrzejewska, B.; Ratajczak-Skrzatek, U.; Piotrowska, N.; Ridush, B.; Zachos, F.E.; Popović, D.; et al. Phylogenetics and Phylogeography of Red Deer MtDNA Lineages during the Last 50 000 Years in Eurasia. Zool. J. Linn. Soc. 2022, 194, 431–456. [Google Scholar] [CrossRef]
- McDevitt, A.D.; Coscia, I.; Browett, S.S.; Ruiz-González, A.; Statham, M.J.; Ruczyńska, I.; Roberts, L.; Stojak, J.; Frantz, A.C.; Norén, K.; et al. Next-Generation Phylogeography Resolves Post-Glacial Colonization Patterns in a Widespread Carnivore, the Red Fox (Vulpes vulpes), in Europe. Mol. Ecol. 2022, 31, 993–1006. [Google Scholar] [CrossRef]
- DeMarche, M.L.; Doak, D.F.; Morris, W.F. Incorporating Local Adaptation into Forecasts of Species’ Distribution and Abundance under Climate Change. Glob. Chang. Biol. 2019, 25, 775–793. [Google Scholar] [CrossRef]
- Bi, K.; Linderoth, T.; Singhal, S.; Vanderpool, D.; Patton, J.L.; Nielsen, R.; Moritz, C.; Good, J.M. Temporal Genomic Contrasts Reveal Rapid Evolutionary Responses in an Alpine Mammal during Recent Climate Change. PLoS Genet. 2019, 15, e1008119. [Google Scholar] [CrossRef] [PubMed] [Green Version]
- Andersen, L.W.; Harms, V.; Caniglia, R.; Czarnomska, S.D.; Fabbri, E.; Jędrzejewska, B.; Kluth, G.; Madsen, A.B.; Nowak, C.; Pertoldi, C.; et al. Long-Distance Dispersal of a Wolf, Canis lupus, in Northwestern Europe. Mammal Res. 2015, 60, 163–168. [Google Scholar] [CrossRef]
- Aoki, D.; Sakamoto, H.; Kitazawa, M.; Kryukov, A.P.; Takagi, M. Migration-Tracking Integrated Phylogeography Supports Long-Distance Dispersal-Driven Divergence for a Migratory Bird Species in the Japanese Archipelago. Ecol. Evol. 2021, 11, 6066–6079. [Google Scholar] [CrossRef]
- Galaverni, M.; Caniglia, R.; Pagani, L.; Fabbri, E.; Boattini, A.; Randi, E. Disentangling Timing of Admixture, Patterns of Introgression, and Phenotypic Indicators in a Hybridizing Wolf Population. Mol. Biol. Evol. 2017, 34, 2324–2339. [Google Scholar] [CrossRef] [Green Version]
- Mattucci, F.; Galaverni, M.; Lyons, L.A.; Alves, P.C.; Randi, E.; Velli, E.; Pagani, L.; Caniglia, R. Genomic Approaches to Identify Hybrids and Estimate Admixture Times in European Wildcat Populations. Sci. Rep. 2019, 9, 11612. [Google Scholar] [CrossRef] [Green Version]
- Willoughby, J.R.; Sundaram, M.; Wijayawardena, B.K.; Kimble, S.J.A.; Ji, Y.; Fernandez, N.B.; Antonides, J.D.; Lamb, M.C.; Marra, N.J.; DeWoody, J.A. The Reduction of Genetic Diversity in Threatened Vertebrates and New Recommendations Regarding IUCN Conservation Rankings. Biol. Conserv. 2015, 191, 495–503. [Google Scholar] [CrossRef] [Green Version]
- Schmidt, C.; Garroway, C.J. The Conservation Utility of Mitochondrial Genetic Diversity in Macrogenetic Research. Conserv. Genet. 2021, 22, 323–327. [Google Scholar] [CrossRef]
- Randi, E.; Ragni, B. Genetic Variability and Biochemical Systematics of Domestic and Wild Cat Populations (Felis silvestris: Felidae). J. Mammal. 1991, 72, 79–88. [Google Scholar] [CrossRef]
- Driscoll, C.A.; Menotti-Raymond, M.; Roca, A.L.; Hupe, K.; Johnson, W.E.; Geffen, E.; Harley, E.H.; Delibes, M.; Pontier, D.; Kitchener, A.C.; et al. The Near Eastern Origin of Cat Domestication. Science 2007, 317, 519–523. [Google Scholar] [CrossRef] [PubMed] [Green Version]
- Senn, H.V.; Ghazali, M.; Kaden, J.; Barclay, D.; Harrower, B.; Campbell, R.D.; Macdonald, D.W.; Kitchener, A.C. Distinguishing the Victim from the Threat: SNP-Based Methods Reveal the Extent of Introgressive Hybridization between Wildcats and Domestic Cats in Scotland and Inform Future in Situ and Ex Situ Management Options for Species Restoration. Evol. Appl. 2019, 12, 399–414. [Google Scholar] [CrossRef] [Green Version]
- Kitchener, A.C.; Breitenmoser-Würsten, C.; Eizirik, E.; Gentry, A.; Werdelin, L.; Wilting, A.; Yamaguchi, N.; Abramov, A.V.; Christiansen, P.; Driscoll, C.A.; et al. A Revised Taxonomy of the Felidae. The Final Report of the Cat Classification Task Force of the IUCN Cat Specialist Group. Cat News Spec. Issue 2017, 11, 80. [Google Scholar]
- Sommer, R.S.; Benecke, N. Late Pleistocene and Holocene Development of the Felid Fauna (Felidae) of Europe: A Review. J. Zool. 2006, 269, 7–19. [Google Scholar] [CrossRef]
- Kitchener, A.C.; Rees, E.E. Modelling the Dynamic Biogeography of the Wildcat: Implications for Taxonomy and Conservation. J. Zool. 2009, 279, 144–155. [Google Scholar] [CrossRef]
- Mattucci, F.; Oliveira, R.; Lyons, L.A.; Alves, P.C.; Randi, E. European Wildcat Populations Are Subdivided into Five Main Biogeographic Groups: Consequences of Pleistocene Climate Changes or Recent Anthropogenic Fragmentation? Ecol. Evol. 2016, 6, 3–22. [Google Scholar] [CrossRef] [Green Version]
- Stahl, P.; Artois, M. Status and Conservation of the Wildcat (Felis silvestris) in Europe and around the Mediterranean Rim. Counc. Eur. Nat. Environ. Ser. 1994, 69, 1–76. [Google Scholar]
- Lozano, J.; Virgos, E.; Cabezas-Diaz, S.; Mangas, J.G. Increase of Large Game Species in Mediterranean Areas: Is the European Wildcat (Felis silvestris) Facing a New Threat? Biol. Conserv. 2007, 138, 321–329. [Google Scholar] [CrossRef]
- Monterroso, P.; Brito, J.C.; Ferreras, P.; Alves, P.C. Spatial Ecology of the European Wildcat in a Mediterranean Ecosystem: Dealing with Small Radio-Tracking Datasets in Species Conservation. J. Zool. 2009, 279, 27–35. [Google Scholar] [CrossRef]
- Portanier, E.; Léger, F.; Henry, L.; Gayet, T.; Queney, G.; Ruette, S.; Devillard, S. Landscape Genetic Connectivity in European Wildcat (Felis silvestris silvestris): A Matter of Food, Shelters and Demographic Status of Populations. Conserv. Genet. 2022, 23, 653–668. [Google Scholar] [CrossRef]
- Vigne, J.-D.; Carrere, I.; Briois, F.; Guilaine, J. The Early Process of Mammal Domestication in the Near East: New Evidence from the Pre-Neolithic and Pre-Pottery Neolithic in Cyprus. Curr. Anthropol. 2011, 52, S255–S271. [Google Scholar] [CrossRef]
- Ottoni, C.; Van Neer, W.; De Cupere, B.; Daligault, J.; Guimaraes, S.; Peters, J.; Spassov, N.; Prendergast, M.E.; Boivin, N.; Morales-Muñiz, A.; et al. The Palaeogenetics of Cat Dispersal in the Ancient World. Nat. Ecol. Evol. 2017, 1, 0139. [Google Scholar] [CrossRef]
- Say, L.; Devillard, S.; Léger, F.; Pontier, D.; Ruette, S.; Leger, F.; Pontier, D.; Ruette, S. Distribution and Spatial Genetic Structure of European Wildcat in France. Anim. Conserv. 2012, 15, 18–27. [Google Scholar] [CrossRef]
- Mattucci, F.; Oliveira, R.; Bizzarri, L.; Vercillo, F.; Anile, S.; Ragni, B.; Lapini, L.; Sforzi, A.; Alves, P.C.; Lyons, L.A.; et al. Genetic Structure of Wildcat (Felis silvestris) Populations in Italy. Ecol. Evol. 2013, 3, 2443–2458. [Google Scholar] [CrossRef]
- Urzi, F.; Šprem, N.; Potočnik, H.; Sindičić, M.; Konjević, D.; Ćirović, D.; Rezić, A.; Duniš, L.; Melovski, D.; Buzan, E. Population Genetic Structure of European Wildcats Inhabiting the Area between the Dinaric Alps and the Scardo-Pindic Mountains. Sci. Rep. 2021, 11, 17984. [Google Scholar] [CrossRef] [PubMed]
- Steyer, K.; Tiesmeyer, A.; Muñoz-Fuentes, V.; Nowak, C. Low Rates of Hybridization between European Wildcats and Domestic Cats in a Human-Dominated Landscape. Ecol. Evol. 2018, 8, 2290–2304. [Google Scholar] [CrossRef] [PubMed] [Green Version]
- Nussberger, B.; Currat, M.; Quilodran, C.S.; Ponta, N.; Keller, L.F. Range Expansion as an Explanation for Introgression in European Wildcats. Biol. Conserv. 2018, 218, 49–56. [Google Scholar] [CrossRef]
- Beugin, M.; Salvador, O.; Leblanc, G.; Queney, G.; Natoli, E.; Pontier, D. Hybridization between Felis silvestris silvestris and Felis silvestris catus in Two Contrasted Environments in France. Ecol. Evol. 2019, 10, 263–276. [Google Scholar] [CrossRef] [Green Version]
- Tiesmeyer, A.; Ramos, L.; Manuel Lucas, J.; Steyer, K.; Alves, P.C.; Astaras, C.; Brix, M.; Cragnolini, M.; Domokos, C.; Hegyeli, Z.; et al. Range-Wide Patterns of Human-Mediated Hybridisation in European Wildcats. Conserv. Genet. 2020, 21, 247–260. [Google Scholar] [CrossRef] [Green Version]
- Quilodrán, C.S.; Nussberger, B.; Macdonald, D.W.; Montoya-Burgos, J.I.; Currat, M. Projecting Introgression from Domestic Cats into European Wildcats in the Swiss Jura. Evol. Appl. 2020, 13, 2101–2112. [Google Scholar] [CrossRef] [Green Version]
- Howard-McCombe, J.; Ward, D.; Kitchener, A.C.; Lawson, D.; Senn, H.V.; Beaumont, M. On the Use of Genome-Wide Data to Model and Date the Time of Anthropogenic Hybridisation: An Example from the Scottish Wildcat. Mol. Ecol. 2021, 30, 3688–3702. [Google Scholar] [CrossRef] [PubMed]
- Baca, M.; Popović, D.; Panagiotopoulou, H.; Marciszak, A.; Krajcarz, M.T.M.M.T.; Krajcarz, M.T.M.M.T.; Makowiecki, D.; Węgleński, P.; Nadachowski, A. Human-Mediated Dispersal of Cats in the Neolithic Central Europe. Heredity 2018, 121, 557–563. [Google Scholar] [CrossRef] [Green Version]
- Mousavi, S.M.; Rezaei, H.R.; Naderi, S. Phylogenetic Relationships of the Wildcat (Felis lybica/ Felis silvestris) in Iran Using MtDNA-NADH5 and Feasibility of Asiatic Wildcat Identification (F. l. ornata) by This Marker. J. Anim. Environ. 2020, 12, 1–10. [Google Scholar] [CrossRef]
- Schauenberg, P. L’identification Du Chat Forestier d’ Europe Felis s silvestris Schreber, 1777 Par Une Methode Osteometrique. Rev. Suisse Zool. 1969, 76, 433–441. [Google Scholar] [PubMed]
- French, D.D.; Corbett, L.K.; Easterbee, N. Morphological Discriminants of Scottish Wildcats (Felis silvestris), Domestic Cats (F. catus) and Their Hybrids. J. Zool. 1988, 214, 235–259. [Google Scholar] [CrossRef]
- Ragni, B.; Possenti, M. Variability of Coat-Colour and Markings System in Felis silvestris. Ital. J. Zool. 1996, 63, 285–292. [Google Scholar] [CrossRef] [Green Version]
- Gerngross, P.; Ambarli, H.; Angelici, F.M.; Anile, S.; Campbell, R.; de Andres, P.F.; Gil-Sanchez, J.M.; Götz, M.; Jerosch, S.; Mengüllüoglu, D.; et al. Felis silvestris. The IUCN Red List of Threatened Species. 2022. Report Number T181049859A181050999. Available online: https://doi.org/10.2305/IUCN.UK.2022-1.RLTS.T181049859A181050999.en (accessed on 24 January 2023). [CrossRef]
- Driscoll, C.; Yamaguchi, N.; O’Brien, S.J.; Macdonald, D.W. A Suite of Genetic Markers Useful in Assessing Wildcat (Felis silvestris Ssp.)-Domestic Cat (Felis silvestris catus) Admixture. J. Hered. 2011, 102 (Suppl. S1), S87–S90. [Google Scholar] [CrossRef] [Green Version]
- Hall, T.A. A User-Friendly Biological Sequence Alignment Editor and Analysis Program for Windows 95/98/NT. Nucleic Acids Symp. Ser. 1999, 41, 95–98. [Google Scholar]
- Librado, P.; Rozas, J. DnaSP v5: A Software for Comprehensive Analysis of DNA Polymorphism Data. Bioinformatics 2009, 25, 1451–1452. [Google Scholar] [CrossRef] [PubMed] [Green Version]
- Altschul, S.F.; Gish, W.; Miller, W.; Myers, E.W.; Lipman, D.J. Basic Local Alignment Search Tool. J. Mol. Biol. 1990, 215, 403–410. [Google Scholar] [CrossRef]
- Lanfear, R.; Frandsen, P.B.; Wright, A.M.; Senfeld, T.; Calcott, B. Partitionfinder 2: New Methods for Selecting Partitioned Models of Evolution for Molecular and Morphological Phylogenetic Analyses. Mol. Biol. Evol. 2017, 34, 772–773. [Google Scholar] [CrossRef] [Green Version]
- Saitou, N.; Nei, M. The Neighbor-Joining Method: A New Method for Reconstructing Phylogenetic Trees. Mol. Biol. Evol. 1987, 4, 406–425. [Google Scholar] [CrossRef]
- Lefort, V.; Longueville, J.-E.; Gascuel, O. SMS: Smart Model Selection in PhyML. Mol. Biol. Evol. 2017, 34, 2422–2424. [Google Scholar] [CrossRef] [PubMed] [Green Version]
- Tamura, K.; Stecher, G.; Kumar, S. MEGA11: Molecular Evolutionary Genetics Analysis Version 11. Mol. Biol. Evol. 2021, 38, 3022–3027. [Google Scholar] [CrossRef]
- Felsenstein, J. Evolutionary Trees from DNA Sequences: A Maximum Likelihood Approach. J. Mol. Evol. 1981, 17, 368–376. [Google Scholar] [CrossRef]
- Guindon, S.; Dufayard, J.-F.; Lefort, V.; Anisimova, M.; Hordijk, W.; Gascuel, O. New Algorithms and Methods to Estimate Maximum-Likelihood Phylogenies: Assessing the Performance of PhyML 3.0. Syst. Biol. 2010, 59, 307–321. [Google Scholar] [CrossRef] [PubMed] [Green Version]
- Bouckaert, R.; Heled, J.; Kühnert, D.; Vaughan, T.; Wu, C.-H.; Xie, D.; Suchard, M.A.; Rambaut, A.; Drummond, A.J. BEAST 2: A Software Platform for Bayesian Evolutionary Analysis. PLoS Comput. Biol. 2014, 10, e1003537. [Google Scholar] [CrossRef] [PubMed] [Green Version]
- Rambaut, A.; Drummond, A.J.; Xie, D.; Baele, G.; Suchard, M.A. Posterior Summarization in Bayesian Phylogenetics Using Tracer 1.7. Syst. Biol. 2018, 67, 901–904. [Google Scholar] [CrossRef] [PubMed] [Green Version]
- Bandelt, H.J.; Forster, P.; Röhl, A. Median-Joining Networks for Inferring Intraspecific Phylogenies. Mol. Biol. Evol. 1999, 16, 37–48. [Google Scholar] [CrossRef] [PubMed]
- Holsinger, K.E.; Weir, B.S. Genetics in Geographically Structured Populations: Defining, Estimating and Interpreting FST. Nat. Rev. Genet. 2009, 10, 639–650. [Google Scholar] [CrossRef] [Green Version]
- Excoffier, L.; Lischer, H.E.L. Arlequin Suite Ver 3.5: A New Series of Programs to Perform Population Genetics Analyses under Linux and Windows. Mol. Ecol. Resour. 2010, 10, 564–567. [Google Scholar] [CrossRef]
- Dupanloup, I.; Schneider, S.; Excoffier, L. A Simulated Annealing Approach to Define the Genetic Structure of Populations. Mol. Ecol. 2002, 11, 2571–2581. [Google Scholar] [CrossRef]
- Beaumont, M.A.; Zhang, W.; Balding, D.J. Approximate Bayesian Computation in Population Genetics. Genetics 2002, 162, 2025–2035. [Google Scholar] [CrossRef] [PubMed]
- Cornuet, J.-M.; Pudlo, P.; Veyssier, J.; Dehne-Garcia, A.; Gautier, M.; Leblois, R.; Marin, J.-M.; Estoup, A. DIYABC v2.0: A Software to Make Approximate Bayesian Computation Inferences about Population History Using Single Nucleotide Polymorphism, DNA Sequence and Microsatellite Data. Bioinformatics 2014, 30, 1187–1189. [Google Scholar] [CrossRef] [PubMed] [Green Version]
- Kimura, M. A Simple Method for Estimating Evolutionary Rates of Base Substitutions through Comparative Studies of Nucleotide Sequences. J. Mol. Evol. 1980, 16, 111–120. [Google Scholar] [CrossRef] [PubMed]
- Hasegawa, M.; Kishino, H.; Yano, T. Dating of the Human-Ape Splitting by a Molecular Clock of Mitochondrial DNA. J. Mol. Evol. 1985, 22, 160–174. [Google Scholar] [CrossRef] [PubMed]
- Simonsen, K.L.; Churchill, G.A.; Aquadro, C.F. Properties of Statistical Tests of Neutrality for DNA Polymorphism Data. Genetics 1995, 141, 413–429. [Google Scholar] [CrossRef]
- Johnson, W.E.; Eizirik, E.; Pecon-Slattery, J.; Murphy, W.J.; Antunes, A.; Teeling, E.; O’Brien, S.J. The Late Miocene Radiation of Modern Felidae: A Genetic Assessment. Science 2006, 311, 73–77. [Google Scholar] [CrossRef] [Green Version]
- Ruiz-González, A.; Jose Madeira, M.; Randi, E.; Urra, F.; Gomez-Moliner, B.J. Non-Invasive Genetic Sampling of Sympatric Marten Species (Martes martes and Martes foina): Assessing Species and Individual Identification Success Rates on Faecal DNA Genotyping. Eur. J. Wildl. Res. 2013, 59, 371–386. [Google Scholar] [CrossRef]
- Niedziałkowska, M. Phylogeography of European Moose (Alces alces) Based on Contemporary MtDNA Data and Archaeological Records. Mamm. Biol. 2017, 84, 35–43. [Google Scholar] [CrossRef]
- Montana, L.; Caniglia, R.; Galaverni, M.; Fabbri, E.; Ahmed, A.; Bolfíková, Č.B.; Czarnomska, S.D.; Galov, A.; Godinho, R.; Hindrikson, M.; et al. Combining Phylogenetic and Demographic Inferences to Assess the Origin of the Genetic Diversity in an Isolated Wolf Population. PLoS ONE 2017, 12, e0176560. [Google Scholar] [CrossRef] [Green Version]
- Scandura, M.; Fabbri, G.; Caniglia, R.; Iacolina, L.; Mattucci, F.; Mengoni, C.; Pante, G.; Apollonio, M.; Mucci, N. Resilience to Historical Human Manipulations in the Genomic Variation of Italian Wild Boar Populations. Front. Ecol. Evol. 2022, 10, 69. [Google Scholar] [CrossRef]
- Mousavi, M.; Naderi, S.; Rezaei, H.R.; Adibi, M.A. Evolutionary History and Distribution of African Wildcat, Felis lybica in Iran. Casp. J. Environ. Sci. 2022, 20, 637–648. [Google Scholar] [CrossRef]
- Li, G.; Davis, B.W.; Eizirik, E.; Murphy, W.J. Phylogenomic Evidence for Ancient Hybridization in the Genomes of Living Cats (Felidae). Genome Res. 2016, 26, 1–11. [Google Scholar] [CrossRef] [PubMed] [Green Version]
- Pilot, M.; Branicki, W.; Jȩdrzejewski, W.; Goszczyski, J.; Jȩdrzejewska, B.; Dykyy, I.; Shkvyrya, M.; Tsingarska, E. Phylogeographic History of Grey Wolves in Europe. BMC Evol. Biol. 2010, 10, 104. [Google Scholar] [CrossRef] [Green Version]
- Mengüllüoğlu, D.; Ambarlı, H.; Barlow, A.; Paijmans, J.L.A.; Sayar, A.O.; Emir, H.; Kandemir, İ.; Hofer, H.; Fickel, J.; Förster, D.W. Mitogenome Phylogeny Including Data from Additional Subspecies Provides New Insights into the Historical Biogeography of the Eurasian Lynx Lynx Lynx. Genes 2021, 12, 1216. [Google Scholar] [CrossRef] [PubMed]
- Pierpaoli, M.; Biro, Z.S.; Herrmann, M.; Hupe, K.; Fernandes, M.; Ragni, B.; Szemethy, L.; Randi, E. Genetic Distinction of Wildcat (Felis silvestris) Populations in Europe, and Hybridization with Domestic Cats in Hungary. Mol. Ecol. 2003, 12, 2585–2598. [Google Scholar] [CrossRef] [Green Version]
- Amori, G.; Castiglia, R. Mammal Endemism in Italy: A Review. Biogeographia 2018, 33, 19–31. [Google Scholar] [CrossRef] [Green Version]
- Meiri, M.; Lister, A.M.; Higham, T.F.G.; Stewart, J.R.; Straus, L.G.; Obermaier, H.; Gonzalez Morales, M.R.; Marin-Arroyo, A.B.; Barnes, I. Late-Glacial Recolonization and Phylogeography of European Red Deer (Cervus elaphus L.). Mol. Ecol. 2013, 22, 4711–4722. [Google Scholar] [CrossRef]
- Valdiosera, C.E.; García, N.; Anderung, C.; Dalén, L.; Crégut-Bonnoure, E.; Kahlke, R.-D.D.; Stiller, M.; Brandström, M.; Thomas, M.G.; Arsuaga, J.L.; et al. Staying out in the Cold: Glacial Refugia and Mitochondrial DNA Phylogeography in Ancient European Brown Bears. Mol. Ecol. 2007, 16, 5140–5148. [Google Scholar] [CrossRef] [Green Version]
- Černa Bolfíková, B.; Eliášová, K.; Loudová, M.; Kryštufek, B.; Lymberakis, P.; Sándor, A.D.; Hulva, P. Glacial Allopatry vs. Postglacial Parapatry and Peripatry: The Case of Hedgehogs. PeerJ 2017, 5, e3163. [Google Scholar] [CrossRef] [Green Version]
- Lucena-Perez, M.; Marmesat, E.; Kleinman-Ruiz, D.; Martínez-Cruz, B.; Węcek, K.; Saveljev, A.P.; Seryodkin, I.V.; Okhlopkov, I.; Dvornikov, M.G.; Ozolins, J.; et al. Genomic Patterns in the Widespread Eurasian Lynx Shaped by Late Quaternary Climatic Fluctuations and Anthropogenic Impacts. Mol. Ecol. 2020, 29, 812–828. [Google Scholar] [CrossRef] [Green Version]
- Kilshaw, K. Scottish Wildcats; Scottish Natural Heritage: Perth, Scotland, 2011. [Google Scholar]
- Kilshaw, K.; Montgomery, R.A.; Campbell, R.D.; Hetherington, D.A.; Johnson, P.J.; Kitchener, A.C.; Macdonald, D.W.; Millspaugh, J.J. Mapping the Spatial Configuration of Hybridization Risk for an Endangered Population of the European Wildcat (Felis silvestris silvestris) in Scotland. Mammal Res. 2016, 61, 1–11. [Google Scholar] [CrossRef]
- Feliner, G.N. Southern European Glacial Refugia: A Tale of Tales. Taxon 2011, 60, 365–372. [Google Scholar] [CrossRef]
- Barbosa, S.; Paupério, J.; Herman, J.S.; Ferreira, C.M.; Pita, R.; Vale-Gonçalves, H.M.; Cabral, J.A.; Garrido-García, J.A.; Soriguer, R.C.; Beja, P.; et al. Endemic Species May Have Complex Histories: Within-Refugium Phylogeography of an Endangered Iberian Vole. Mol. Ecol. 2017, 26, 951–967. [Google Scholar] [CrossRef]
- Vähä, J.P.; Primmer, C. Efficiency of Model-Based Bayesian Methods for Detecting Hybrid Individuals under Different Hybridization Scenarios and with Different Numbers of Loci. Mol. Ecol. 2006, 15, 63–72. [Google Scholar] [CrossRef] [PubMed]
- Vigne, J.D.; Guilaine, J.; Debue, K.; Haye, L.; Gérard, P.; Gerard, P.; Ge, P. Early Taming of the Cat in Cyprus. Science 2004, 304, 259. [Google Scholar] [CrossRef] [Green Version]
- Kurtén, B. Pleistocene Mammals of Europe; Aldine Publishing Company: London, UK, 1968. [Google Scholar]
- Macdonald, D.W.; Mosser, A.; Gittleman, J.L. Felid Society. In Biology and Conservation of Wild Felids, 1st ed.; Macdonald, D.W., Loveridge, A.J., Eds.; Oxford University Press: Oxford, UK, 2010; pp. 125–160. [Google Scholar]
- Minter, M.; O’Brien, D.; Cottrell, J.; Ennos, R.; Hill, J.K.; Hall, J. Exploring the Potential for ‘Gene Conservation Units’ to Conserve Genetic Diversity in Wild Populations. Ecol. Solut. Evid. 2021, 2, e12061. [Google Scholar] [CrossRef]
Figure 1.
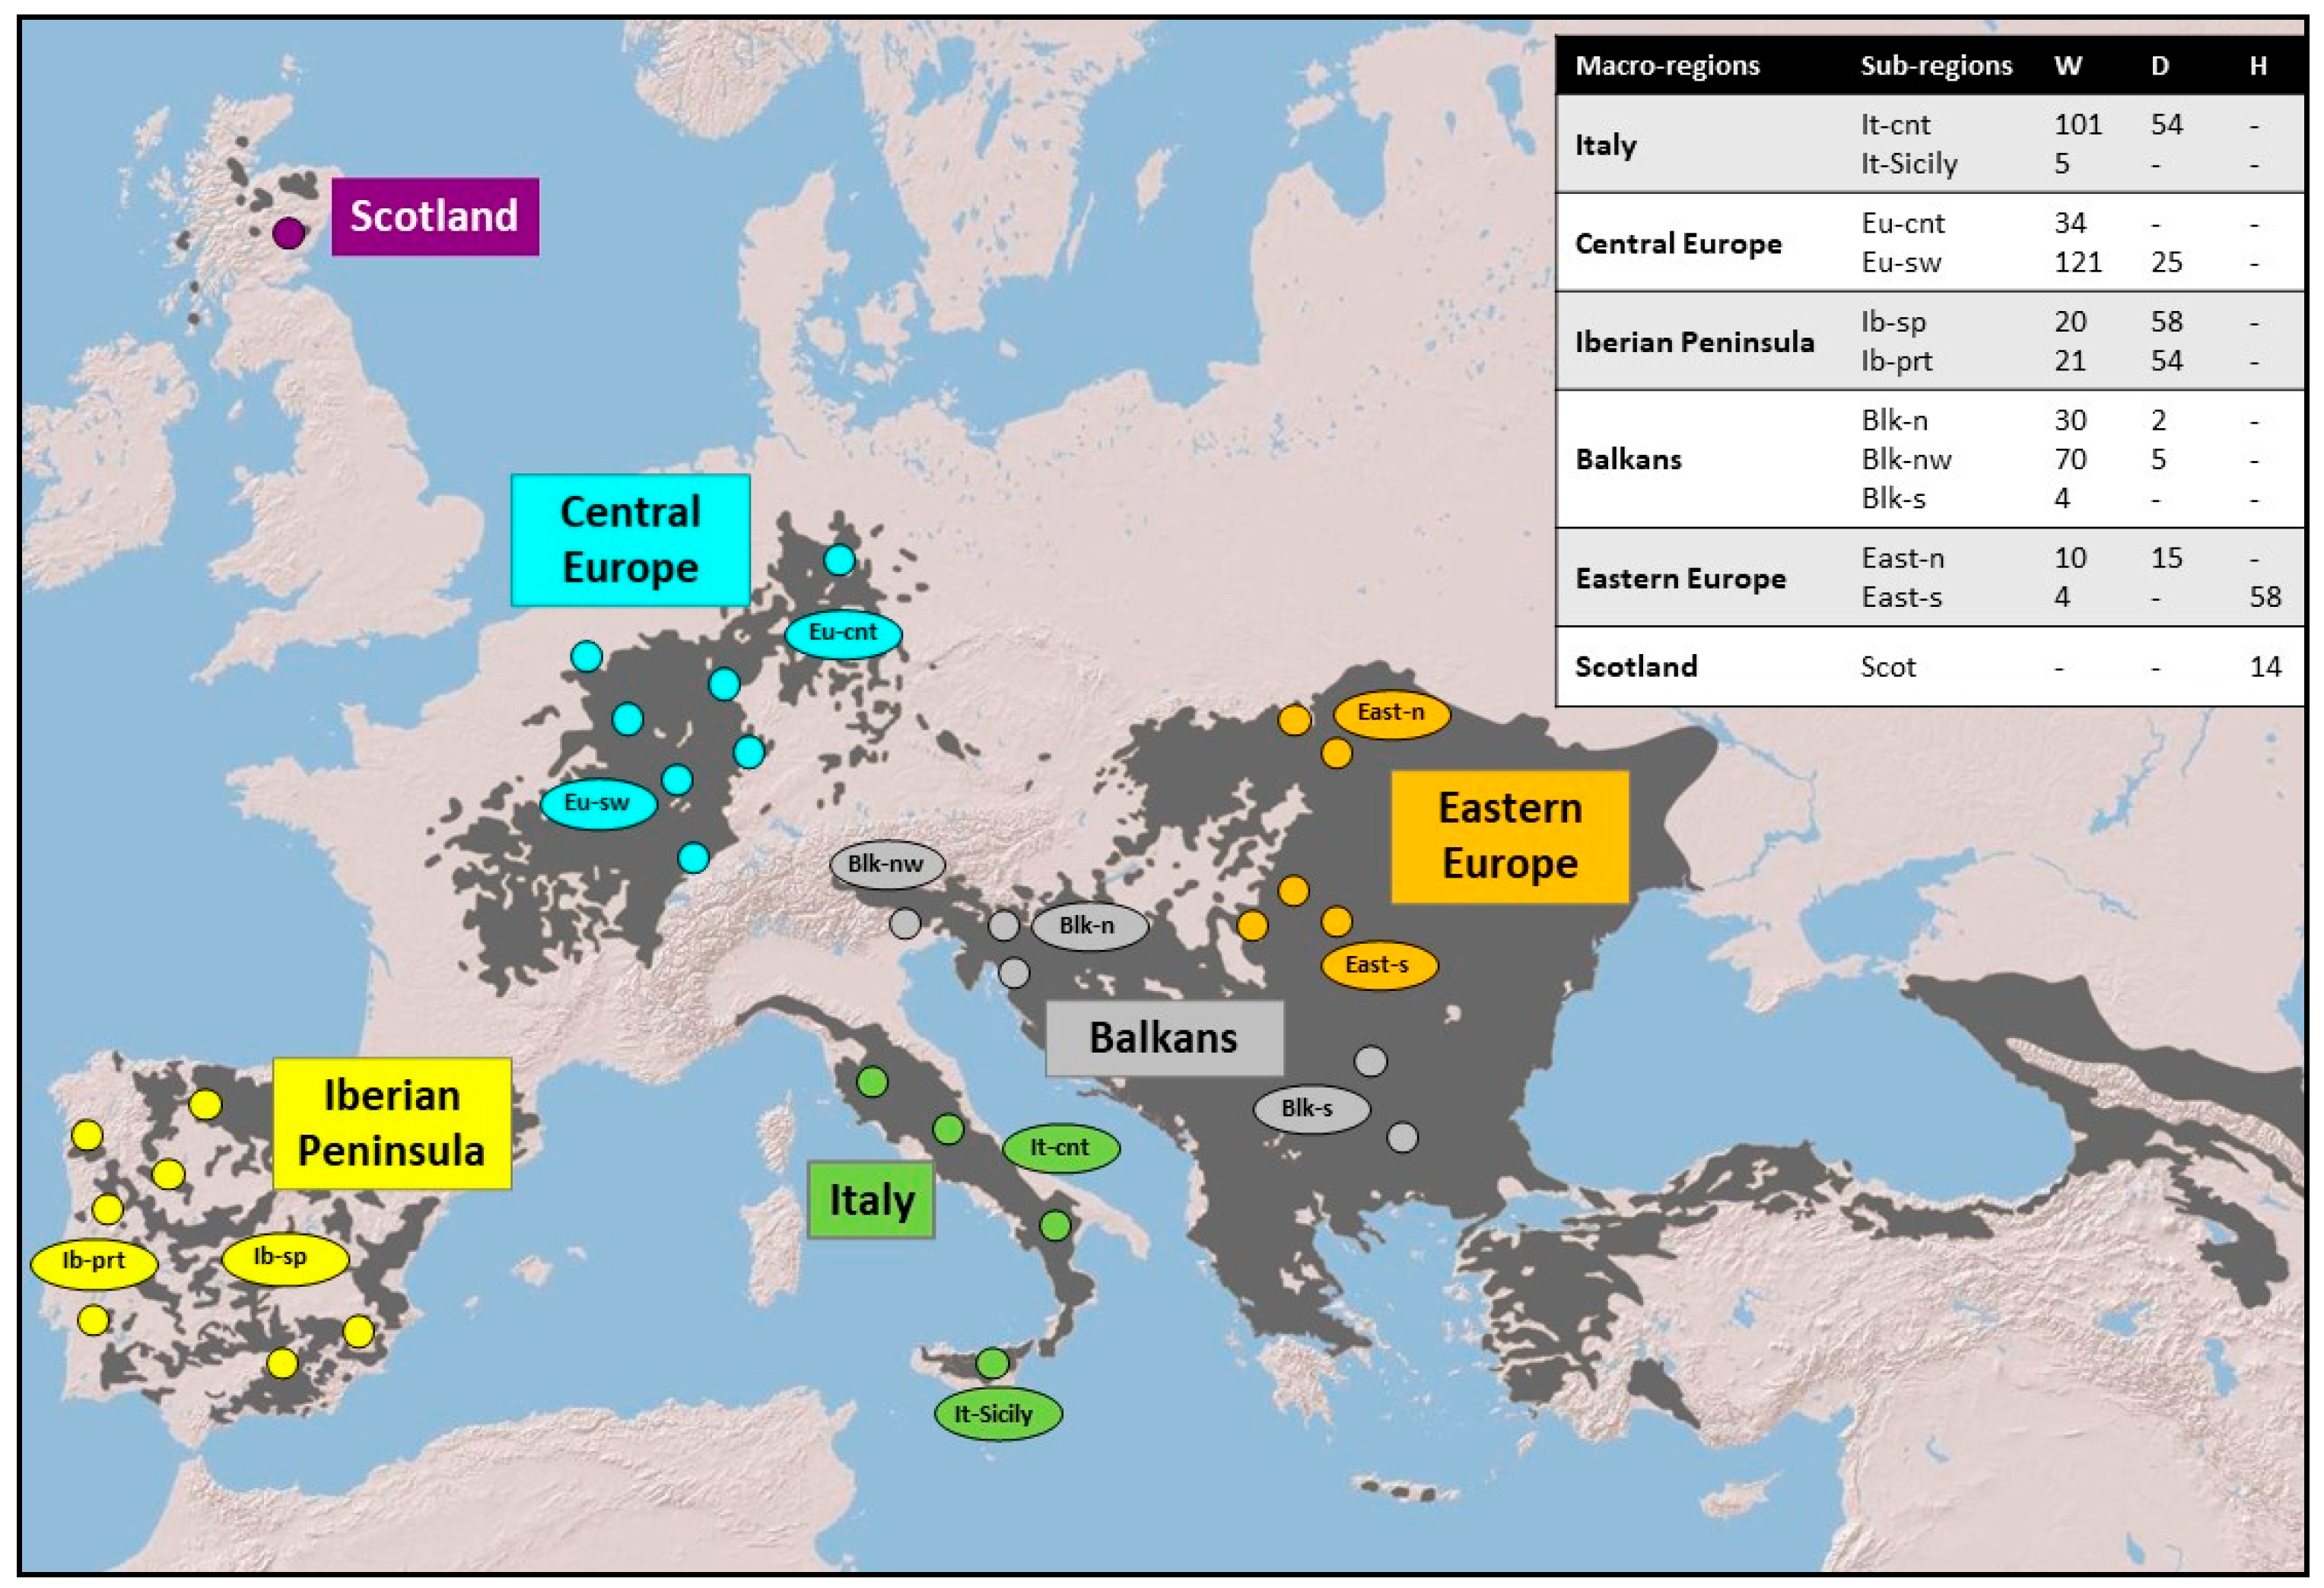
Map of the approximate cat sampling locations. Dark grey areas correspond to the most recently updated IUCN Felis silvestris distribution range [46]. Macro-regions (Italy, Central Europe, Iberian Peninsula, Balkans, Eastern Europe, Scotland) are indicated in different colors. Each macro-region was further subdivided into sub-regions (It-cnt: Central Italy; It-Sicily: Sicily; Eu-cnt: Center–North Germany; Eu-sw: Southern and Western regions of Central Europe; Ib-prt: Portugal; Ib-sp: Spain; Balk-n: Northern Balkans; Balk-s: Southern Balkans; Balk-nw Eastern Italian Alps and North-Western Dinarides; East-n: Poland; East-s: Hungary). Samples from the North-Eastern Italian Alps were included in the Balkans group (blk-nw) according to the most recent genetic structure detected in Europe through Bayesian assignment procedures performed using nuclear microsatellite genetic profiles [25]. Small circles indicate the approximate geographic locations within the main sampling areas. Each sub-region is provided with the number of analyzed samples classified on the base of their 31-STR assignment values [25]: W = wildcat; D = domestic cat; H = putative admixed. Further details are available in Supplementary Table S1.
Figure 1.
Map of the approximate cat sampling locations. Dark grey areas correspond to the most recently updated IUCN Felis silvestris distribution range [46]. Macro-regions (Italy, Central Europe, Iberian Peninsula, Balkans, Eastern Europe, Scotland) are indicated in different colors. Each macro-region was further subdivided into sub-regions (It-cnt: Central Italy; It-Sicily: Sicily; Eu-cnt: Center–North Germany; Eu-sw: Southern and Western regions of Central Europe; Ib-prt: Portugal; Ib-sp: Spain; Balk-n: Northern Balkans; Balk-s: Southern Balkans; Balk-nw Eastern Italian Alps and North-Western Dinarides; East-n: Poland; East-s: Hungary). Samples from the North-Eastern Italian Alps were included in the Balkans group (blk-nw) according to the most recent genetic structure detected in Europe through Bayesian assignment procedures performed using nuclear microsatellite genetic profiles [25]. Small circles indicate the approximate geographic locations within the main sampling areas. Each sub-region is provided with the number of analyzed samples classified on the base of their 31-STR assignment values [25]: W = wildcat; D = domestic cat; H = putative admixed. Further details are available in Supplementary Table S1.

Figure 2.
(a) Bayesian mtDNA tree (BT) computed in Beast [57] showing the phylogenetic relationships among ND5 haplotypes obtained from all the 715 analyzed cat samples. Capitalized letters (D, W) indicate the two main lineages. Roman numerals (I–V) in coloured box indicate the main clades. Grey cartoons indicate the estimated node divergence times, whose 95% posterior density confidential intervals are reported in brackets. Annotated nodes show the Bayesian highest posterior density values and also the respective bootstrap values derived from the NJ and ML trees. (b) MJ networks among ND5 haplotypes were obtained from all 715 analyzed cat samples. Haplotypes, according to the 31-STR Bayesian assignment values of their belonging samples [25], were partitioned and colored as domestic, wild, and putative admixed groups. (c) MJ networks among ND5 haplotypes, including only wildcats and putative admixed individuals (n = 502). Each haplotype was divided and colored according to the proportion of individuals belonging to each biogeographic macro-region. Small bars indicate the number of mutations (greater than one) between two different haplotypes. The frequency of each haplotype is proportional to the size of the circles.

Figure 3.
Distribution map of the main six haplogroup clades derived from the Bayesian tree. Donut charts show the proportional frequency of haplogroups of lineage W. The inscribed pie charts show the proportional frequency of lineage DW (lineage D pruned by domestic cats). Circles are approximately proportional to sample size. Black solid curved lines trace the geographical separations among genetic clusters detected in both lineages W and DW through SAMOVA analyses, while dotted line shows the additional genetic separation found for lineage W. Black numbers in white circles indicate the clusters found by SAMOVA analyses for lineage W. White numbers in black circles show the clusters found by SAMOVA analyses for lineage DW.

Figure 4.
Mismatch distribution plots computed using haplogroups showing significant values of Tajima’s D and Fu and Li’s F indexes. Larger plots show mismatch distribution results about lineage D (considering only domestic cat samples) and lineage W. Smaller plots show mismatch distribution results about different macro-regions within each of the two lineages.

Figure 5.
Graphical representation of the resulting population sizes and divergence times estimated for the two best-simulated scenarios inferred by ABC simulations, using a generation time g = 2 years. The width of branches is proportional to the inferred effective population sizes. (a) The best scenario was inferred using lineage W haplotypes. (b) The best scenario was inferred using lineage DW (lineage D pruned by domestic cats) haplotypes. Cluster numbers refer to the best K repartition obtained by SAMOVA analyses for each of the two lineages.


Table 1.
Summary of genetic variability statistics obtained by analyzing a portion of the mitochondrial ND5 gene and considering as sample groups: (a) STR Bayesian assignment cat populations [25]; (b) main phylogenetic lineages; and (c) biogeographic macro-regions within each phylogenetic lineage. For lineages W and DW (lineage D pruned by domestic cats), the statistics are also provided for each macro-region. N = number of samples; SD = standard deviation.
| N | Number of Haplotypes | Nucleotide Diversity (π ± SD) | Haplotype Diversity (h ± SD) | Tajima’s D | p-Value | Fu and Li’s F | p-Value | |||||
|---|---|---|---|---|---|---|---|---|---|---|---|---|
| Overall | 715 | 28 | 0.870 | ± | 0.013 | 0.862 | ± | 0.006 | ||||
| Domestic cats | 213 | 12 | 0.230 | ± | 0.150 | 0.735 | ± | 0.018 | −0.413 | 0.078 | −2.337 | 0.026 |
| Putative admixed | 72 | 8 | 0.686 | ± | 0.378 | 0.797 | ± | 0.027 | 1.145 | 0.173 | 4.129 | 0.442 |
| Wildcats | 430 | 20 | 1.063 | ± | 0.552 | 0.813 | ± | 0.011 | 2.297 | 0.405 | 4.534 | 0.280 |
| Lineage D | 448 | 14 | 0.247 | ± | 0.161 | 0.746 | ± | 0.012 | −0.347 | 0.067 | −2.271 | 0.046 |
| Lineage W | 267 | 14 | 0.255 | ± | 0.166 | 0.720 | ± | 0.021 | −0.452 | 0.059 | −2.789 | 0.030 |
| Italy | 55 | 4 | 0.048 | ± | 0.055 | 0.173 | ± | 0.068 | −1.025 | 0.043 | −1.780 | 0.009 |
| Central Europe | 117 | 7 | 0.165 | ± | 0.121 | 0.676 | ± | 0.034 | −0.359 | 0.098 | −0.706 | 0.103 |
| Iberian Peninsula | 40 | 5 | 0.245 | ± | 0.164 | 0.637 | ± | 0.063 | 0.434 | 0.135 | 1.091 | 0.260 |
| Balkans | 43 | 2 | 0.014 | ± | 0.028 | 0.047 | ± | 0.044 | −1.480 | 0.001 | −0.723 | 0.042 |
| Eastern Europe | 8 | 4 | 0.230 | ± | 0.174 | 0.750 | ± | 0.139 | 1.347 | 0.234 | −0.375 | 0.030 |
| Scotland | 7 | 1 | ||||||||||
| Lineage DW | 235 | 7 | 0.208 | ± | 0.142 | 0.581 | ± | 0.034 | 0.415 | 0.223 | 0.742 | 0.202 |
| Italy | 54 | 4 | 0.207 | ± | 0.144 | 0.461 | ± | 0.058 | 1.288 | 0.359 | 1.942 | 0.388 |
| Central Europe | 41 | 3 | 0.037 | ± | 0.047 | 0.096 | ± | 0.062 | −2.002 | 0.000 | −1.107 | 0.047 |
| Iberian Peninsula | 8 | 2 | 0.064 | ± | 0.073 | 0.429 | ± | 0.169 | 0.334 | 0.479 | 0.536 | 0.132 |
| Balkans | 61 | 5 | 0.260 | ± | 0.170 | 0.571 | ± | 0.055 | 1.461 | 0.366 | 1.828 | 0.341 |
| Eastern Europe | 64 | 4 | 0.199 | ± | 0.139 | 0.656 | ± | 0.035 | 1.235 | 0.384 | 1.993 | 0.406 |
| Scotland | 7 | 1 | ||||||||||
Table 2.
Analysis of molecular variance (AMOVA) on a portion of the mitochondrial ND5 gene computed among and within three different sample groups: (a) the STR Bayesian assignment populations [25]; (b) the main phylogenetic lineages; and (c) the biogeographic macro-regions within each phylogenetic lineage. ϕST: differences among groups; ϕSC: differences among populations within a group. All values were highly significant (p < 0.05). Lineage DW represents lineage D pruned by domestic cats.
| Source of Variation | Variance Components | Percentage of Variation | Differentiation Indexes |
|---|---|---|---|
| Among wildcats, domestic cats, and putative admixed | 1.51 | 36.66 | ϕST = 0.37 |
| Within wildcats, domestic cats, and putative admixed | 2.60 | 63.34 | |
| Among lineages W/DW | 5.68 | 86.68 | ϕST = 0.92 |
| Among macro-regions/within lineages | 0.37 | 5.60 | ϕSC = 0.42 |
| Within macro-regions | 0.51 | 7.72 | |
| Lineage W | |||
| Among macro-regions | 0.59 | 58.24 | ϕST = 0.58 |
| Within macro-regions | 0.42 | 41.76 | |
| Lineage DW | |||
| Among macro-regions | 0.12 | 17.21 | ϕST = 0.17 |
| Within macro-regions | 0.60 | 82.79 |
Disclaimer/Publisher’s Note: The statements, opinions and data contained in all publications are solely those of the individual author(s) and contributor(s) and not of MDPI and/or the editor(s). MDPI and/or the editor(s) disclaim responsibility for any injury to people or property resulting from any ideas, methods, instructions or products referred to in the content. |
© 2023 by the authors. Licensee MDPI, Basel, Switzerland. This article is an open access article distributed under the terms and conditions of the Creative Commons Attribution (CC BY) license (https://creativecommons.org/licenses/by/4.0/).
Share and Cite
MDPI and ACS Style
Velli, E.; Caniglia, R.; Mattucci, F. Phylogenetic History and Phylogeographic Patterns of the European Wildcat (Felis silvestris) Populations. Animals 2023, 13, 953. https://doi.org/10.3390/ani13050953
AMA Style
Velli E, Caniglia R, Mattucci F. Phylogenetic History and Phylogeographic Patterns of the European Wildcat (Felis silvestris) Populations. Animals. 2023; 13(5):953. https://doi.org/10.3390/ani13050953
Chicago/Turabian StyleVelli, Edoardo, Romolo Caniglia, and Federica Mattucci. 2023. "Phylogenetic History and Phylogeographic Patterns of the European Wildcat (Felis silvestris) Populations" Animals 13, no. 5: 953. https://doi.org/10.3390/ani13050953
Note that from the first issue of 2016, this journal uses article numbers instead of page numbers. See further details here.