
Evaluating Changes in the Multiyear Predictability of the Pacific Decadal Oscillation Using Model Analogs since 1900
1
Key Laboratory of Marine Hazards Forecasting, Ministry of Natural Resources, Hohai University, Nanjing 210024, China
2
College of Oceanography, Hohai University, Nanjing 210024, China
3
Southern Laboratory of Ocean Science and Engineering (Zhuhai), Zhuhai 519000, China
*
Author to whom correspondence should be addressed.
J. Mar. Sci. Eng. 2023, 11(5), 980; https://doi.org/10.3390/jmse11050980
Submission received: 6 April 2023
/
Revised: 29 April 2023
/
Accepted: 2 May 2023
/
Published: 4 May 2023
(This article belongs to the Special Issue Frontiers in Physical Oceanography)
Abstract
:In this study, we investigate the changes in the multiyear predictability of the Pacific decadal oscillation (PDO) since 1900. A newly developed method, the model-analog method, is used to hindcast the PDO from 1900 to 2015. Model-analog hindcast provides comparable PDO prediction skills with the traditional assimilation-initialized forecast but with much lower computational costs. Our results show that PDO prediction skills have significantly changed over time. Specifically, the PDO could skillfully be predicted up to 5 years in advance in 1910–1960, but it can only be predicted 2–3 years in advance after 1960. We attribute these changes to the strength of the re-emergence process, where deep oceanic mixed layer temperature anomalies from one winter reappear in the following winters. In the high-prediction-skill period, the stronger re-emergence process provides more predictable information, leading to enhanced multiyear prediction skills. Our study offers new insights into the multiyear predictability of the PDO over a long-time frame and sheds light on the reasons behind the low prediction skill of the PDO.
1. Introduction
The Pacific decadal oscillation (PDO), defined as the leading sea surface temperature (SST) pattern in the North Pacific poleward of 20° N, is the most prominent decadal climate variability in the North Pacific [1]. In its positive phase, the PDO is characterized by cooling over the western and central North Pacific, surrounded by warming along the western coastline of North America. The PDO adjusts the climate and ecosystem by changing SST and the intensity of the Aleutian Low and generating west wind stress curl anomalies, which have great impacts on the global climate [2].
As the leading mode of decadal SST variability in the North Pacific, the PDO has been treated as a prominent source of multiyear climate prediction in the pan-Pacific region. Previous studies indicate that the PDO is associated with several phenomena [3,4], such as teleconnections from the El Niño–Southern Oscillation (ENSO) through atmospheric bridges [5], large-scale stochastic atmospheric forcing via the intrinsic variability of the Aleutian Low, ocean memory through the re-emergence mechanism [6], and Rossby wave signatures along the Kuroshio–Oyashio Extension region [7]. Due to this complexity, PDO multiyear predictability has been typically evaluated by coupled climate models using ensemble forecasts, with reported skills being relatively low. For example, Kim et al. [8] analyzed the PDO index in the decadal hindcast simulations of seven coupled models and found that only one model and the multi-model mean demonstrated a prediction skill of over 90% in confidence level for the first 1–4 years. Some recent studies using coupled models indicate that the spatial pattern of the PDO could be predicted quite well with an almost 10-year lead, but the temporal correlation of the PDO index is only significant for the first 2–3 years and declines toward zero subsequently [9,10]. All these studies confirm that the multiyear predictability of the PDO index is quite low. Nevertheless, it is worth noting that all decadal hindcast simulations analyzed in these studies were only available after 1960 because of the high computational costs involved. It remains entirely unclear how PDO’s predictability is before 1960 and whether it has changed over time. To answer these questions, it is necessary to examine a lengthy record of the hindcast of the PDO from earlier periods.
There are two distinct classes of predictability: The predictability associated with initial conditions is referred to as the predictability of the first kind, whereas that associated with the slowly evolving boundary conditions or external forcing, e.g., greenhouse gas, anthropogenic forcing, and volcanic eruptions, is defined as predictability of the second kind. Both factors could influence predictability on a multiyear time scale [11]. Liu and Di Lorenzo [12] conducted a review and found that the proper initialization of the ocean can enhance PDO predictability in coupled climate models in the first several years, and the forced response to radiative forcing dominates predictability at longer time scales. This paper specifically examines the predictability of PDO resulting from internal variability, which is the first type of predictability.
This study investigates the multiyear predictability of the PDO and associated sources by a newly developed model-analog method [13]. The model-analog method involves analyzing observed climate fields and identifying the most similar simulated fields, based on a range of factors such as location, time, and climate variables. These simulations are then used to forecast the observed climate, requiring no additional model integrations. While the model-analog method has been primarily employed in seasonal predictability studies, recent research has demonstrated its potential for multiyear predictions [13,14,15,16,17]. For instance, Menary et al. [17] achieved multiyear predictions in North Atlantic SST anomalies using the model-analog method comparable to assimilation-initialized systems. In this study, we apply the model-analog method for PDO multiyear predictability, which has not yet been studied. Using 40 pre-industrial control simulations available via the 6th phase of the Coupled Model Intercomparison Project (CMIP6) [16], we hindcasted the SST anomalies over the North Pacific since 1900. With the model-analog hindcast, we investigate the changes in multiyear PDO prediction skills, which have rarely been investigated in previous research.
2. Method and Data
2.1. Model-Analog Method
We predict the North Pacific SST anomalies by applying the model-analog method proposed by Ding et al. [13]. The model-analog method assumes that adequately similar climate regimes will have rather similar climate pathways for some duration. The most similar climate states from a library are called analogs for a given target state. In practice, analogs are chosen by minimizing the metric of the distance between the target state and each library state following
where n is the nth grid point, and N is the total number of grid points. Superscript m refers to a variable, where M is the total number of variables. The area-averaged standard deviation of each variable is and , and t and t’ are the time of the observation and library state, respectively. Here, the target state was defined as the observation state at the initial time, and the library consisted of 40 CMIP6 preindustrial simulations. Distances are sorted in ascending order. The top K library states closest to observation state are selected into the analog ensemble, indicated by set . The subsequent evolution of these model analogs within climate model simulations, , provides the forecast ensemble for the target state at lead time τ.
In this paper, the K anomalous model states that best match the initial observed SST anomalies in the Pacific region (120° E–170° W,10° S–65° N) are chosen as the initial ensemble. The subsequent evolution of these analogs then provides the forecast ensemble. We chose SST as the targeted variable, since it has long-term observed data. Additionally, SST is an essential parameter in climate predictions, which is likely to provide significant skill. Following Ding et al. [13], the impacts of the ensemble size are evaluated in terms of the representation of the initial target states using distance d (see Equation (1)) between the target states and corresponding ensemble-mean model-analog state vectors. It shows that the initial ensemble-mean distance decreases as ensemble size K increases, implying the improvement of the model-analog hindcast. Additionally, this improvement becomes steady when ensemble size K reaches 20 (Figure S1). Hence, an ensemble of 20 analogs (K = 20) is drawn. We do not weigh the ensemble members, which means that all members are equally weighted to construct the ensemble mean. The final model-analog perdition is the ensemble mean of the 20 members.
2.2. Model and Observational Data
Data from the preindustrial control integration of 40 CMIP6 models are analyzed (Table S1) [18]. We concatenate them into a 25,000-year multimodel time series as the library data. Annual mean data are used. The observed annual mean SST during 1900–2020 is also used, which is from the Met Office Hadley Center’s Sea Surface Temperature dataset (HadISST) [19]. It is utilized to construct target states in the model-analog method and hindcast verification. Both the model and observation are interpolated on a common 2° × 2° grid, which enters the model-analog method. The observed monthly ocean temperature during 1900–2010 is derived from Simple Ocean Data Assimilation (SODA version 2.2.4) [20]. The annual mean sea level pressure (SLP) data during 1900–2010 are derived from ECMWF twentieth century reanalysis (ERA-20C) [21]. In this study, we only focus on the multiyear predictability arising from the internal variability; linear trends have been removed for all variables before analyses.
2.3. Prediction Skill Metrics
We use two deterministic skill measures to evaluate the PDO prediction skills: the anomaly correlation coefficient (ACC) and the standardized root mean squared error (SRMSE). The SRMSE is the root mean squared error (RMSE) between the ensemble mean and observations, normalized by the observed climatological standard deviation. When the prediction matches well with observations, ACC is high and SRMSE is low. The confidence interval of the forecast skills is calculated using the bootstrapping scheme. The PDO index is defined as the time series of the leading empirical orthogonal function (EOF) of the SST anomalies in the Pacific Ocean (20° N–60° N), with trends removed. Lagged correlation analysis is used to measure the persistence of the PDO index, which is defined as the correlation between the observed PDO index and the PDO time series of a succeeding lag year in a given length of a period.
3. Results
3.1. Validation of Model-Analogs Hindcasts
In our study, we perform a North Pacific model-analog hindcast of SST anomalies covering the period from 1900 to 2015, and we analyze the resulting hindcasts at various lead times from 0 to 5 years. The PDO is defined as the leading empirical orthogonal function (EOF) of annual mean SST anomalies in the Pacific Ocean between 20° N and 60° N, with trends removed, along with its associated principal component time series (i.e., the PDO index). We compute the PDO for each lead year of the hindcast and compare it to observations.
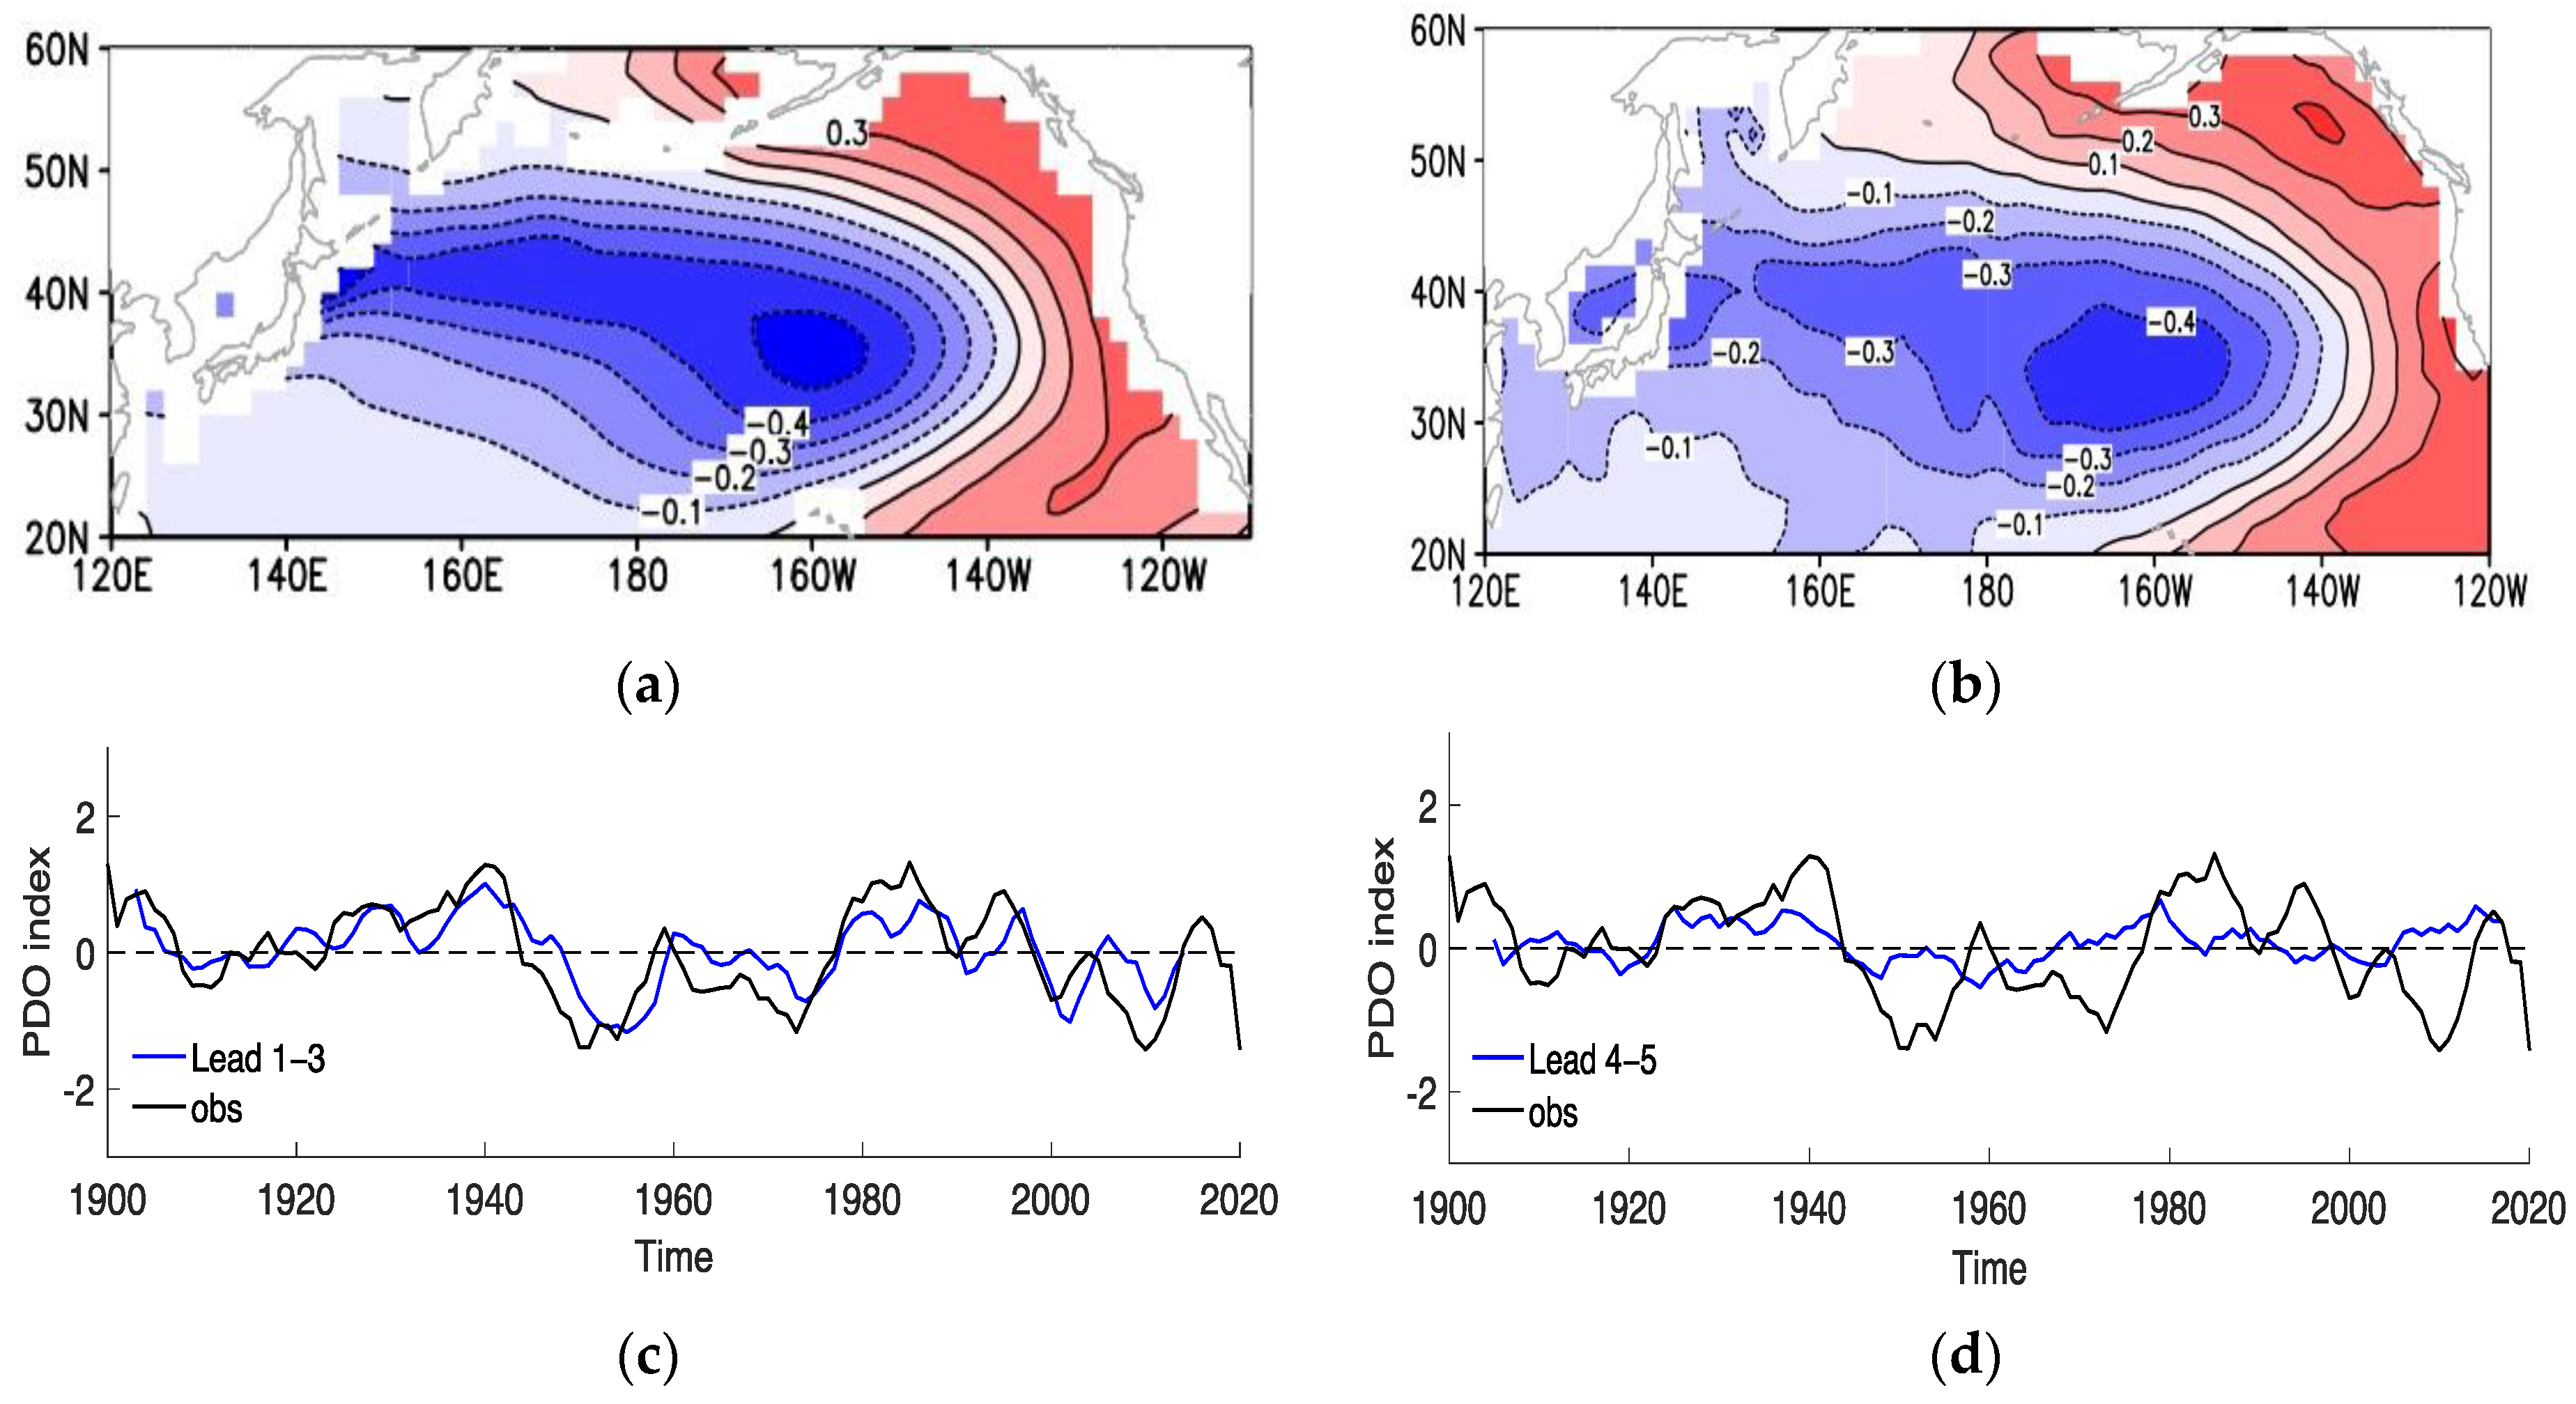
Figure 1a shows the predicted PDO pattern at a 0-year lead during the period from 1900 to 2015. In the positive phase of the predicted PDO, cold temperatures were observed in the central and western North Pacific, surrounded by warm temperatures in the eastern North Pacific. This results in a horseshoe-shaped pattern of SST anomalies that is highly consistent with observations (Figure 1b). The predicted PDO patterns are almost the same at all leads and are all significantly correlated with their counterparts in observations, with values exceeding 0.85. This indicates that the model-analog hindcast contained meaningful variability patterns.
Figure 1c/d shows the observed PDO index (black line) and the predicted PDO index (blue line) at a lead time of 1–3/4–5 years. The observed PDO index has undergone several phase transitions, which occurred around 1925, 1947, and 1977 (Figure 1c,d). To show decadal and multidecadal variability, 5-year smoothing is conventionally applied to both the observed and predicted PDO indexes to remove high-frequency variations [22]. The observed PDO index has exhibited significant multidecadal variability at approximately 20- to 30-year periods since 1900 [4,23]. At a short lead time of 1–3 years, the model-analog hindcast is able to capture the phase transition and predict the amplitude variations of the observed PDO index since the predicted PDO index exhibits a significant correlation coefficient (0.76) with observations. At a longer lead time of 4–5 years, model-analog predictions show a very limited ability to capture the phase transition and predict the amplitude variations of the observed PDO index. In particular, after 1960, the predicted and observed indexes exhibit opposite phases (Figure 1d). The predicted PDO index at 4–5 years lead has no significant correlations with the observed PDO index during 1900–2015.
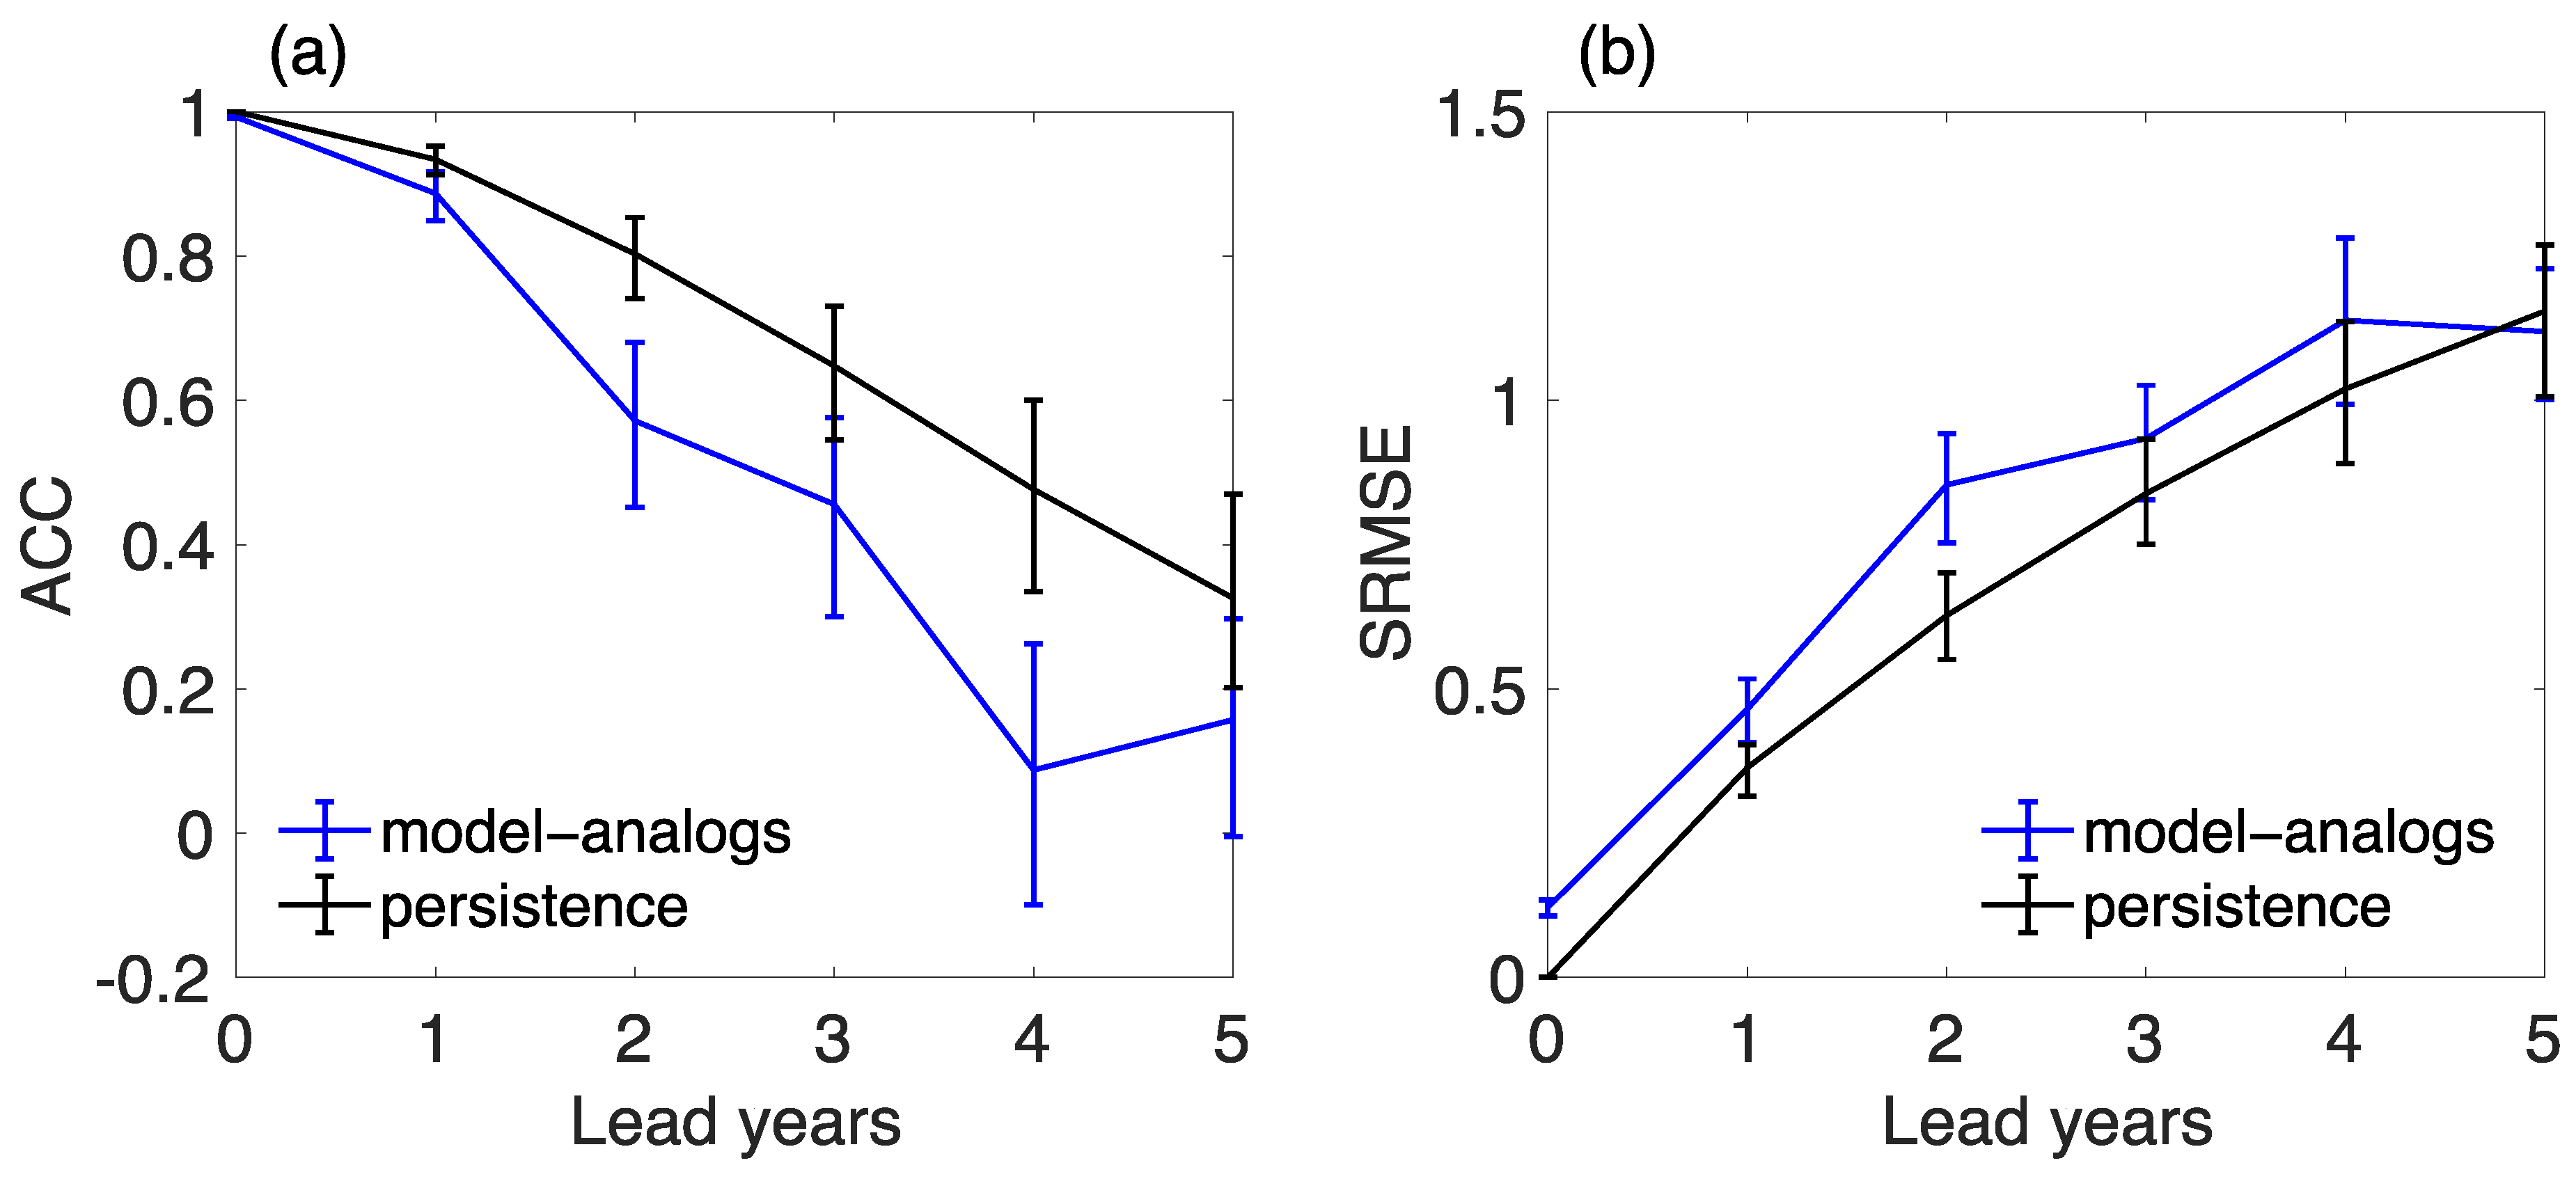
We calculate the ACC and SRMSE between the observed and predicted annual mean PDO index to assess the prediction skill at different leads further. Figure 2a shows that the ACC of the PDO index is significant and exceeds 0.5 for the first three leads. For leads longer than 3 years, the ACC drops dramatically and is insignificant. The SRMSE (Figure 2b) shows consistent results with the prediction error exceeding one standard deviation of the observed PDO at leads longer than 3 years. Both ACC and SRMSE results indicate that the model analogs could provide skillful predictions for PDO within 3 years. This prediction skill is comparable with that of the assimilation-initialized hindcast shown in previous studies [8,9,10]. According to a persistence analysis, PDO persistence has a significantly higher correlation skill than the hindcast, with a prediction skill of about 5 years in advance. The SRMSE results also suggest that persistence outperforms the model-analog hindcast, particularly for short leads. These outcomes align with previous research findings, which demonstrate that the persistence of the PDO exceeds hindcast skills [8,9]. Previous studies explain the outcomes as PDO is principally a first-order autoregressive process, i.e., an AR1 process, of stochastic atmospheric forcing and ENSO influences; its predictable time cannot extend to the persistence time [12]. Overall, the model-analog hindcast has a comparable prediction skill with the assimilation-initialized hindcast, suggesting that the model-analog hindcast offers a reliable long-term product for studying PDO predictability. In the following, we focus on the changes in PDO predictability at a multiyear time scale.
3.2. Changes in the PDO Predictability in Historical Periods
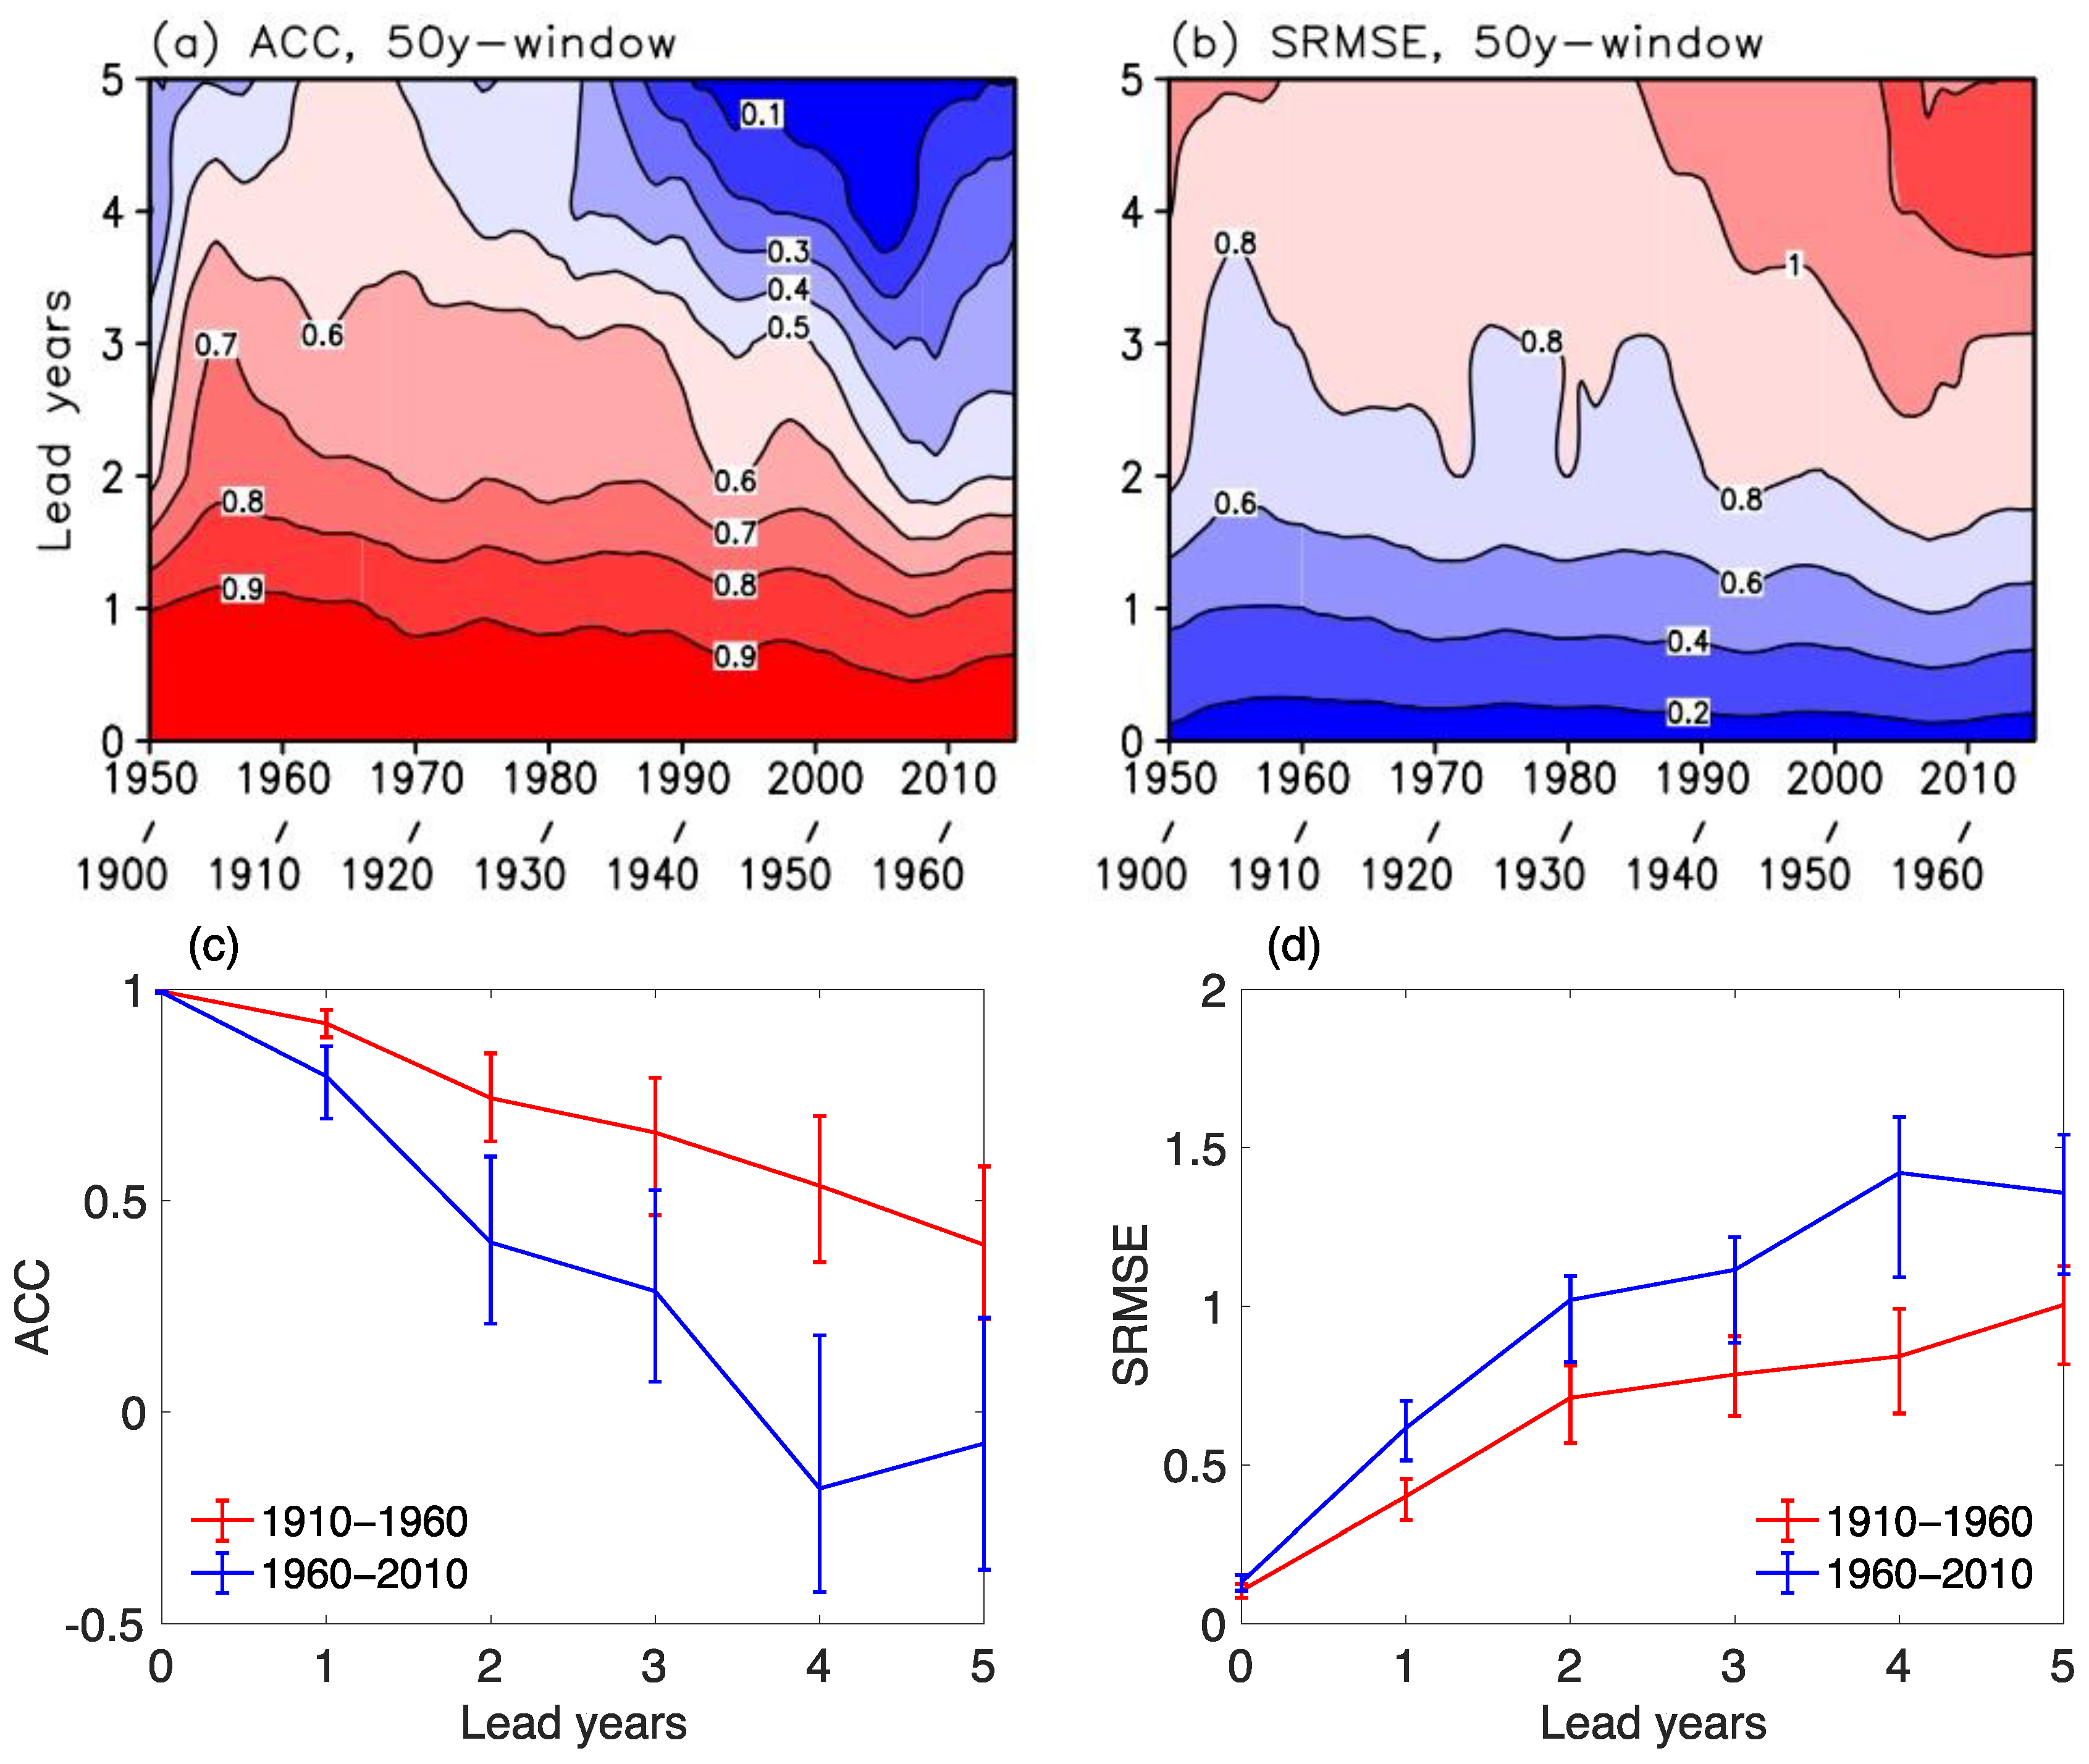
Here, we detect the PDO predictability changes in historical periods by analyzing the prediction skill of the model-analog hindcast. Figure 3a,b shows the ACC and SRMSE of the predicted PDO index with a 50-year running window. Note that when the prediction matches well with observations, the ACC is high and the SRMSE is low. Both ACC and SRMSE show much higher prediction skills in the first half but reduced skills in the later half of the 20th century. This suggests that the PDO is much more predictable in the earlier periods than in the later periods of the 20th century. Consistent results are obtained by using 40-year or 60-year running windows (not shown).
To validate the finding, we select the periods of 1910–1960 and 1960–2010 as the respective periods of high and low PDO prediction skills and examine the ACC and SRMSE of the predicted PDO index (Figure 3c,d). During 1910–1960, the ACC for the PDO prediction remains at about 0.5 at a 5-year lead, indicating that the skillful PDO prediction extended beyond 5 years in advance. On the other hand, the PDO prediction skill from 1960–2010 is relatively low. The ACC drops below 0.3 at a 3-year lead. The prediction errors also exceed one standard deviation at a 2- to 3-year lead. This suggests that the hindcast provides a skillful prediction of only 2–3 years during 1960–2010. A statistically significant test based on a bootstrapping scheme is also conducted (Figure 3c,d). The results demonstrate that the prediction skills of these two periods are significantly different over most lead years, indicating that the PDO skill changes are real. It is worth noting that most PDO prediction studies only analyze prediction skills after 1960 due to limited computational resources [8,9,10]. Our results confirm the changes in the PDO’s predictability, suggesting a possibility of high prediction skills over some decades. Thus, our work offers valuable insight into PDO predictability over a longer time frame.
An interesting question arises as to what results in the changes in PDO prediction skills. Although the mechanisms driving multiyear PDO predictability are not well understood, there is a consensus that the ocean dynamics, particularly the re-emergence process, play a crucial role [3,24]. Specifically, ocean temperature anomalies in the cold season would be preserved under the shallow thermocline during the warm season and are mixed back toward the sea’s surface again in the following cold season [25]. This process occurs over a large portion of the North Pacific Ocean [26] and could provide enhanced multiyear predictability for the PDO [4,12,24,27].
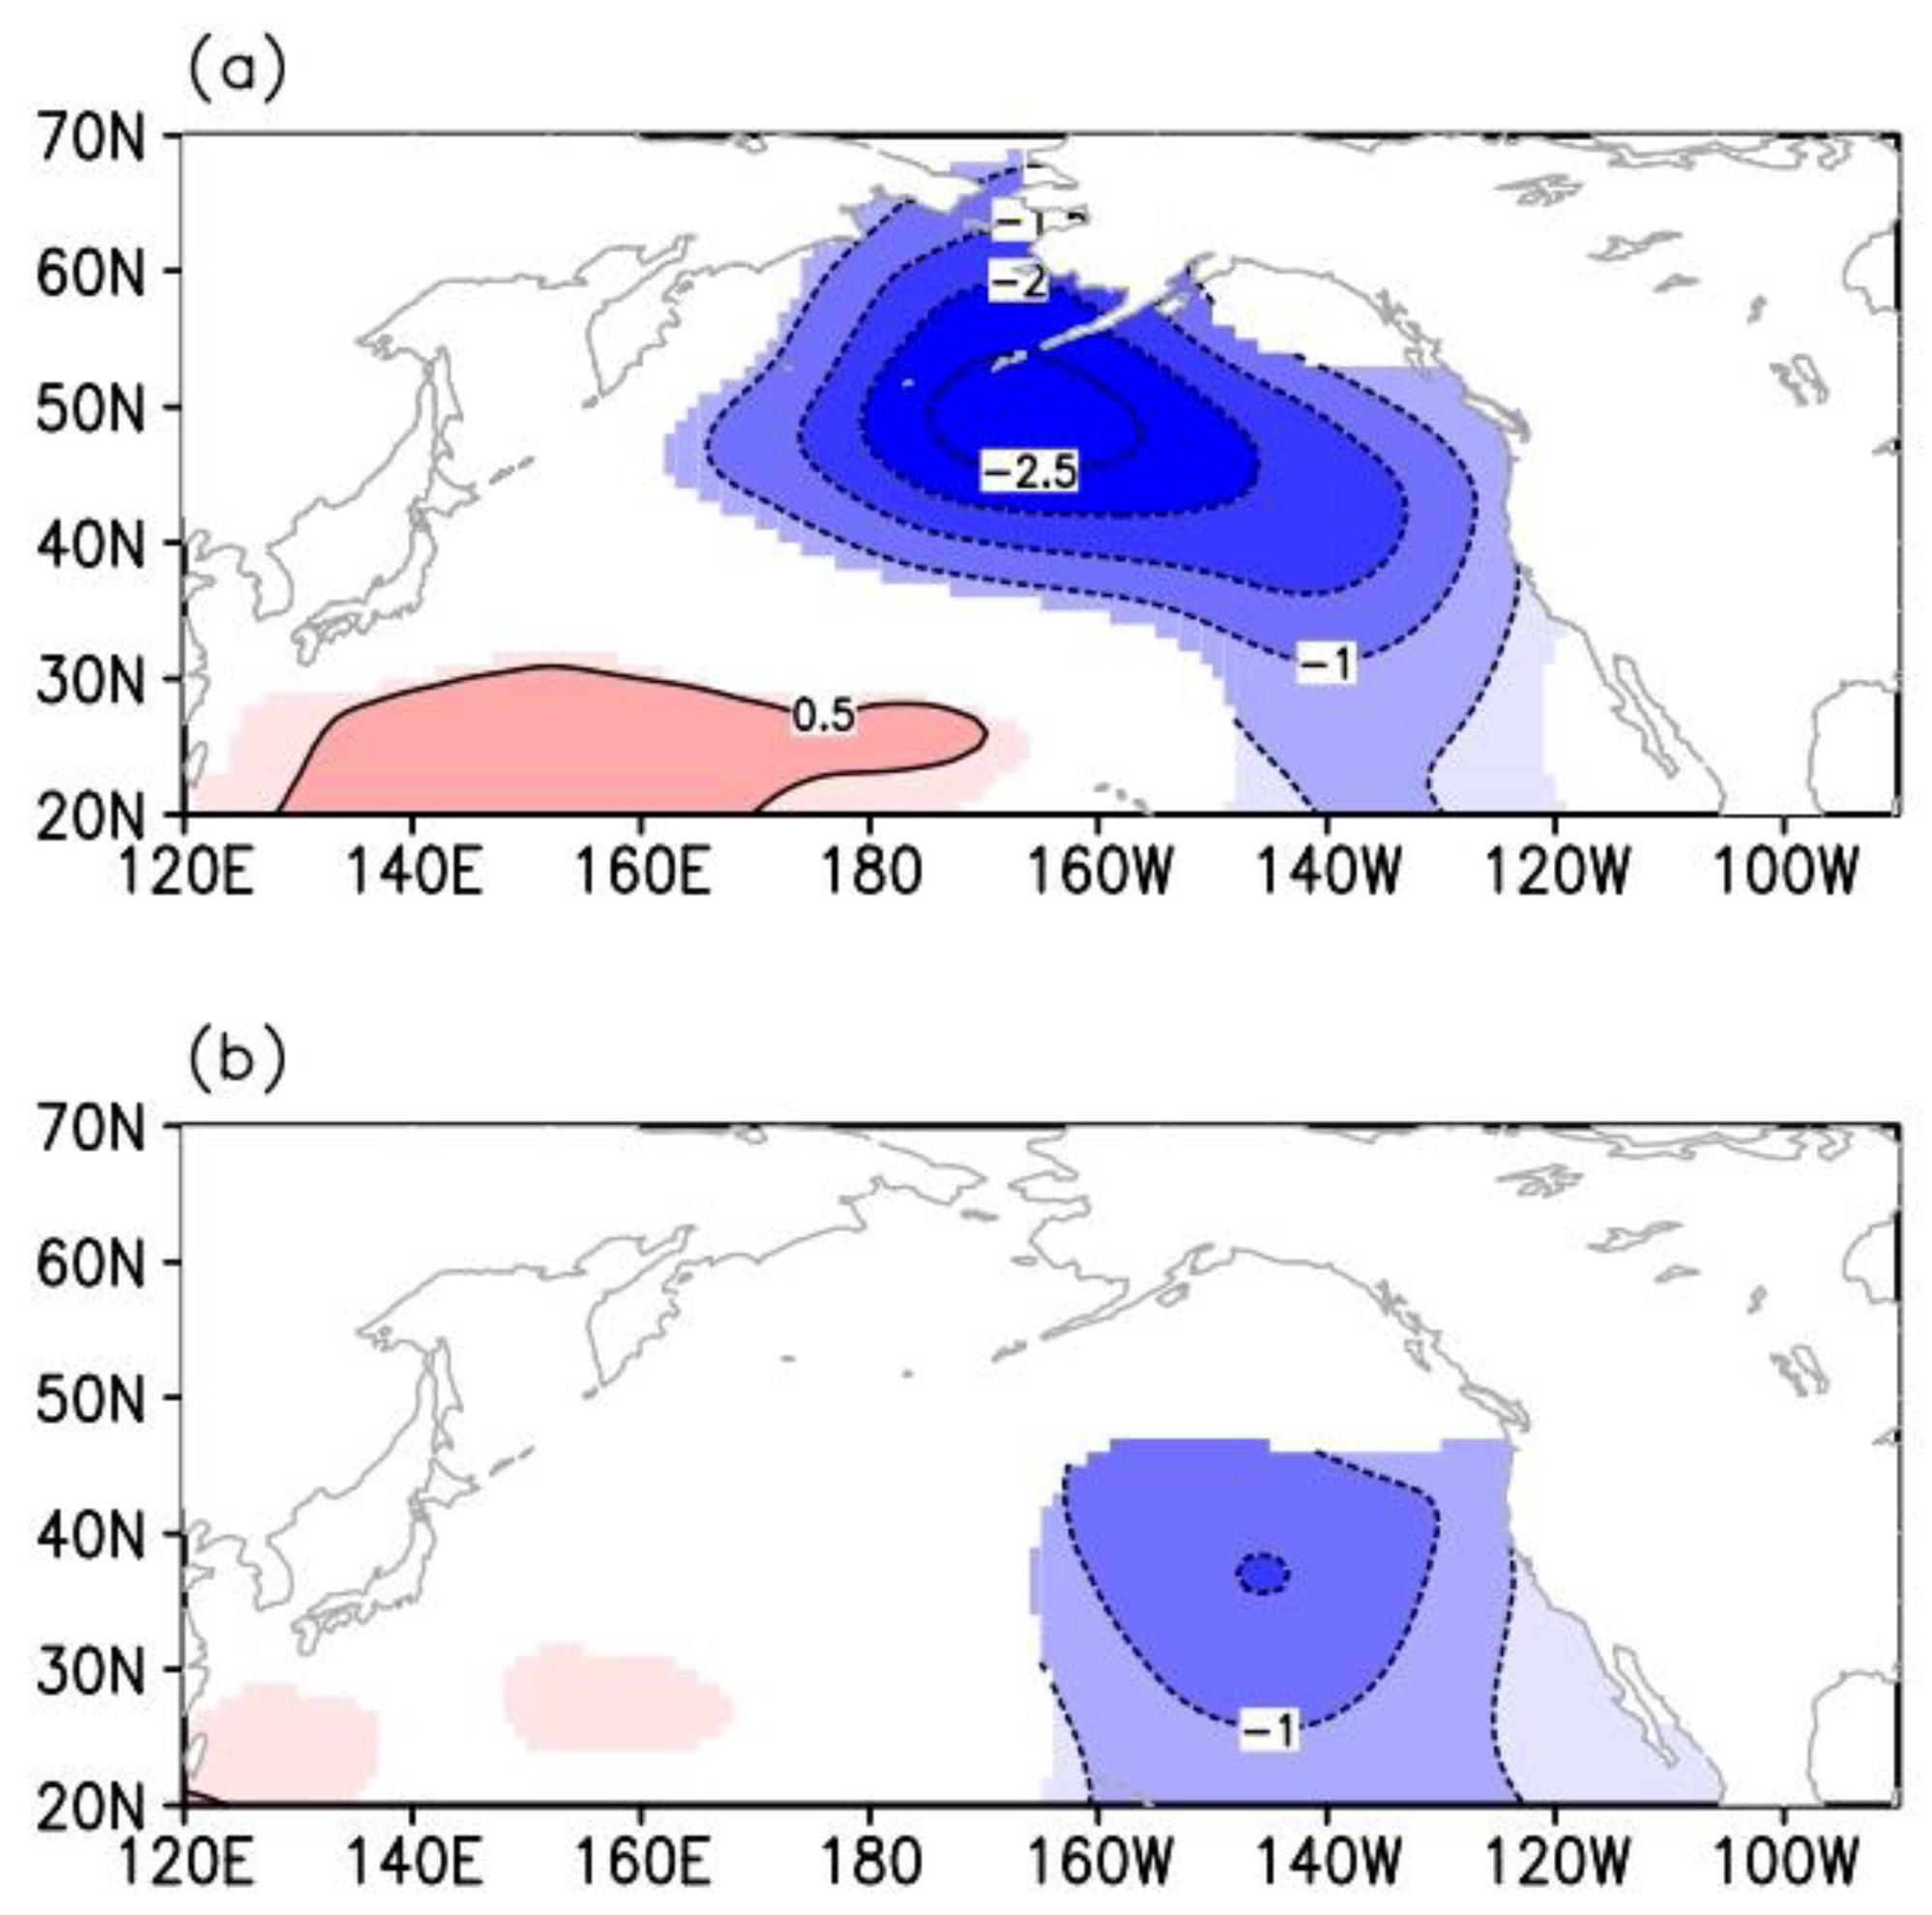
To investigate the influences of the re-emergence process in the changes in the multiyear PDO predictability, we compare its strength in periods with high- and low-PDO-prediction skills using reanalysis data. Figure 4 shows a lag-regression analysis of monthly vertical ocean temperature anomalies (i.e., the area averages over the northwestern Pacific: 145°–165° E, 40°–45° N) with the (annual) PDO time series separately for two periods: 1910–1960 and 1960–2010. We select this region due to its robust re-emergence process and its association with the most significant PDO-related multiyear predictability, as identified in previous studies [4,27]. Negative years mean that the PDO index leads to ocean temperature anomalies. We also conducted the same analysis using ocean temperature data derived from the EN4 dataset [28], and the results are similar (not shown).
It is evident that during a positive PDO-index phase, negative SST anomalies are observed over the northwestern Pacific, and they are very likely driven by turbulent heat flux. The anomalies are then subducted into the subsurface layers during winter and preserved under the seasonal thermocline in summer. During the following winters, cold temperature anomalies re-emerge at the surface [6,25]. The re-emergence of temperature anomalies is observed in both periods. However, significant differences in its strength are noted between periods with high- and low-PDO-prediction skills. During 1910–1960, the re-emergence process is much more pronounced, with significant negative values remerging over the next 3 years. On the other hand, during 1960–2010, the negative temperature could only re-emerge onto the surface in the following 1–2 winters. A more robust re-emergence process could provide more predictable information, suggesting that the strength of the re-emergence process may have a significant impact on the changes in PDO multiyear predictions.
4. Discussion
Skillful predictions of the PDO are crucial to global and regional climate. However, most studies have analyzed multiyear PDO prediction skills only after 1960 and have reported low prediction skills. This study uses a newly developed approach, the model-analog method, to conduct a long-term hindcast of the PDO since 1900. The results show a significant change in the prediction skill of PDO, with skills higher before 1960 and lower after. We tried to investigate the source of prediction skill changes and found that the re-emergence process may be an important factor. According to recent studies, it seems that the vertical entrainment of subsurface temperature anomalies, anomalous Ekman meridional advection, and surface heat flux anomalies are all factors that contribute to the reappearance of ocean temperature anomalies in subsequent winters [29]. During 1910–1960, these processes may be more pronounced and can enhance the re-emergence’s strength.
To confirm the changes in PDO predictability during 1910–1960 and 1960–2010, we calculated the ACC of the PDO’s persistence during these two periods. This indicates a significant prediction skill for about 5 years in advance for both periods, but the persistence of the PDO is higher during 1910–1960 (Figure S2). This suggests a change in PDO multiyear predictability since 1900.
As stated in the Introduction, ENSO also significantly influences PDO variations. However, the extent to which it contributes to multiyear PDO predictability remains controversial [3,24]. The ENSO itself could be predicted only at a multi-seasonal scale. Hence, some studies considered that ENSO variability acts largely as noise relative to the multiyear predictability of PDO [4,12]. However, recent empirical studies suggest that ENSO can significantly enhance the North Pacific’s multiyear predictability [30]. The influence from ENSO through the atmospheric bridge explains a large portion of the SST variance in the North Pacific. Via the re-emergence process, the effects of ENSO become integrated into the North Pacific SST over time, which may result in enhanced decadal variations and the increased persistence of the PDO [31,32].
We also examine the ENSO’s impact on PDO during the periods of 1910–1960 and 1960–2010 using reanalysis data. Figure 5 shows the ENSO-related SLP signal over the North Pacific region (obtained by regression of SLP upon the ENSO index). The regression pattern shows a significant similarity with the Aleutian Low, indicating that ENSO-forced SLP signals in the North Pacific are strongly linked to the Aleutian Low. Compared to the low-prediction-skill era of 1960–2010, the influence of ENSO on the North Pacific is much more significant during 1910–1960, with ENSO’s effects extending significantly to the subpolar region. On the other hand, during 1960–2010, ENSO’s influences become weaker and were only limited to the mid-latitude. However, it is still uncertain whether the enhanced ENSO influences would result in higher PDO prediction skills, and further studies are required to determine this.
Other ocean dynamics, such as the propagation of the Rossby waves in the North Pacific, may also contribute to the multiyear predictability of PDO [3]. However, due to the need for more reliable sea level data before the satellite era, the effects of Rossby waves on changes in PDO prediction skills would not be detected in this study.
There are some limitations of the model-analog method. When the climate models being used as the library have systematic biases, these biases can impact the accuracy and performance of model-analog predictions [13]. In this paper, 40 CMIP6 model data were combined into a library, and model analogs were selected in the library for analysis. Previous studies indicate that although most CMIP6 models simulate the well-defined spatial patterns of the PDO, there are significant differences between the simulated and observed PDO time series [30]. This implies that we could further improve PDO prediction skills by improving climate models. Additionally, using different combinations of predictors could also impact prediction skills with model analogs [13,16]. In this study, only SST was used as the predictor for PDO prediction (see method part). Including other variables, such as ocean heat content or subsurface temperature anomalies, may also improve PDO prediction skills.
5. Conclusions
The PDO is a major source of decadal variability that plays a crucial role in global climate modulation. In light of its importance, we utilize the model-analog method to hindcast North Pacific SST from 1900 to 2015 and examined changes in PDO prediction skills in this study. The model-analog method relies on the assumption that adequately similar climate regimes will have similar climate pathways for some duration. It uses preexisting long climate simulations to forecast observed target states. Analogs are identified from model states that closely match the target states, and the subsequent evolution of these analogs provides a forecast ensemble. Hence, forecast ensembles are extracted from pre-existing model simulations and require no additional model integrations. Compared with the traditional assimilation-initialized hindcast, the model-analog method could largely reduce computational costs [13,16,17]. The results indicate that the model-analog ensemble mean performs comparably to assimilation-initialized forecasts for PDO multiyear predictions.
Our study has revealed significant differences in the multiyear predictability of the PDO since 1900. There are higher PDO prediction skills before 1960 and lower skills after that. Specifically, before 1960, skillful PDO predictions could be made up to 5 years in advance. However, after 1960, the primary period analyzed in previous studies [8,9,10], skillful predictions can only be made up to 2–3 years in advance, which is consistent with previous works.
Further analyses suggest that changes in PDO prediction skills may be due to strength differences in the re-emergence processes. Over the North Pacific, deep oceanic mixed layer temperature anomalies from one winter become decoupled from the surface during summer and then re-emerge via entrainment into the mixed layer as it deepens the following winters [6]. This re-emergence process provides more predictable information, leading to increased predictability [27]. During the high-prediction-skill period in 1910–1960, the re-emergence process is more pronounced as the temperature anomalies reappear in the following 3 years. On the other hand, during 1960–2010, the temperature anomalies would only reappear in the following 1–2 years. The strength of the re-emergence process may be a critical factor in changing the PDO prediction skill.
Overall, this study provides valuable insights into the multiyear predictability of the PDO within a long time frame and highlights the potential of the model-analog method for multiyear predictions. Further analyses, including the effects of dynamical ocean processes and ocean–atmosphere interactions, are necessary for a more comprehensive understanding of changes in PDO prediction skills.
Supplementary Materials
The following supporting information can be downloaded at: https://www.mdpi.com/article/10.3390/jmse11050980/s1, Figure S1: Time mean of initial distance d (see Equation (1)) using the ensemble mean of model-analogs as a function of ensemble size of analogs. Figure S2: ACC of the PDO persistence during 1910–1960 and 1960–2010, with bars indicating a 90% confidence interval determined by bootstrapping scheme. Table S1: Preindustrial simulations used in the CMIP6 ensemble.
Author Contributions
The study was conceived by X.Y. and Y.W., who initiated the research and developed the overall concept. Y.W. wrote the initial manuscript in discussion with X.Y. All authors contributed to the result interpretation and the discussion of the associated dynamics and reviewed and approved the final version. All authors have read and agreed to the published version of the manuscript.
Funding
This work is jointly supported by the National Natural Science Foundation of China (42176028), the Fundamental Research Funds for the Central Universities, Hohai University (B210201021), and the Innovation Group Project of Southern Marine Science and Engineering Guangdong Laboratory (Zhuhai) (311022006).
Institutional Review Board Statement
Not applicable.
Informed Consent Statement
Not applicable.
Data Availability Statement
The CMIP6 and reanalysis data used in this study are all openly available at locations cited in the reference section.
Conflicts of Interest
The authors declare no conflict of interest.
References
- Mantua, N.J.; Hare, S.R.; Zhang, Y.; Wallace, J.M.; Francis, R.C. A Pacific Interdecadal Climate Oscillation with Impacts on Salmon Production. Bull Amer. Meteor. Soc. 1997, 78, 1069–1079. [Google Scholar] [CrossRef]
- Meehl, G.A.; Hu, A.; Santer, B.D. The Mid-1970s Climate Shift in the Pacific and the Relative Roles of Forced versus Inherent Decadal Variability. J. Clim. 2009, 22, 780–792. [Google Scholar] [CrossRef]
- Schneider, N.; Cornuelle, B. The Forcing of the Pacific Decadal Oscillation. J. Clim. 2005, 18, 4355–4373. [Google Scholar] [CrossRef]
- Newman, M.; Alexander, M.A.; Ault, T.R.; Cobb, K.M.; Deser, C.; Di Lorenzo, E.; Mantua, N.J.; Miller, A.J.; Minobe, S.; Nakamura, H.; et al. The Pacific Decadal Oscillation, Revisited. J. Clim. 2016, 29, 29. [Google Scholar] [CrossRef]
- Alexander, M.A.; Bladé, I.; Newman, M.; Lanzante, J.R.; Lau, N.C.; Scott, J.D. The Atmospheric Bridge: The Influence of ENSO Teleconnections on Air–Sea Interaction over the Global Oceans. J. Clim. 2002, 15, 2205–2231. [Google Scholar] [CrossRef]
- Deser, C.; Alexander, M.A.; Timlin, M.S. Understanding the Persistence of Sea Surface Temperature Anomalies in Midlatitudes. J. Clim. 2003, 16, 57–72. [Google Scholar] [CrossRef]
- Qiu, B. Kuroshio Extension Variability and Forcing of the Pacific Decadal Oscillations: Responses and Potential Feedback. J. Phys. Oceanogr. 2003, 33, 2465–2482. [Google Scholar] [CrossRef]
- Kim, H.-M.; Webster, P.J.; Curry, J.A. Evaluation of short-term climate change prediction in multi-model CMIP5 decadal hindcasts. Geophys. Res. Lett. 2012, 39, L1070. [Google Scholar] [CrossRef]
- Wiegand, K.N.; Brune, S.; Baehr, J. Predictability of Multiyear Trends of the Pacific Decadal Oscillation in an MPI-ESM Hindcast Ensemble. Geophys. Res. Lett. 2019, 46, 318–325. [Google Scholar] [CrossRef]
- Boer, G.J.; Sospedra-Alfonso, R. Assessing the skill of the Pacific Decadal Oscillation (PDO) in a decadal prediction experiment. Clim. Dyn. 2019, 53, 5763–5775. [Google Scholar] [CrossRef]
- Meehl, G.A.; Goddard, L.; Murphy, J.; Stouffer, R.J.; Boer, G.; Danabasoglu, G.; Dixon, K.; Giorgetta, M.A.; Greene, A.M.; Hawkins, E.D.; et al. Decadal Prediction: Can It Be Skillful? Bull Amer. Meteor. Soc. 2009, 90, 1467–1486. [Google Scholar] [CrossRef]
- Liu, Z.; Di Lorenzo, E. Mechanisms and Predictability of Pacific Decadal Variability. Curr. Clim. Chang. Rep. 2018, 4, 128–144. [Google Scholar] [CrossRef]
- Ding, H.; Newman, M.; Alexander, M.A.; Wittenberg, A. Skillful Climate Forecasts of the Tropical Indo-Pacific Ocean Using Model-Analogs. J. Clim. 2018, 31, 5437–5459. [Google Scholar] [CrossRef]
- Ding, H.; Newman, M.; Alexander, M.A.; Wittenberg, A.T. Diagnosing Secular Variations in Retrospective ENSO Seasonal Forecast Skill Using CMIP5 Model-Analogs. Geophys. Res. Lett. 2019, 46, 1721–1730. [Google Scholar] [CrossRef]
- Ding, H.; Newman, M.; Alexander, M.A.; Wittenberg, A.T. Relating CMIP5 Model Biases to Seasonal Forecast Skill in the Tropical Pacific. Geophys. Res. Lett. 2020, 47, e2019GL086765. [Google Scholar] [CrossRef]
- Wang, Y.; Zhang, Z.; Huang, P. An improved model-based analogue forecasting for the prediction of the tropicalIndo-PacificSea surface temperature in a coupled climate model. Int. J. Clim. 2020, 40, 6346–6360. [Google Scholar] [CrossRef]
- Menary, M.B.; Mignot, J.; I Robson, J. Skilful decadal predictions of subpolar North Atlantic SSTs using CMIP model-analogues. Environ. Res. Lett. 2021, 16, 064090. [Google Scholar] [CrossRef]
- Eyring, V.; Bony, S.; Meehl, G.A.; Senior, C.A.; Stevens, B.; Stouffer, R.J.; Taylor, K.E. Overview of the Coupled Model Intercomparison Project Phase 6 (CMIP6) experimental design and organization. Geosci. Model Dev. 2016, 9, 1937–1958. [Google Scholar] [CrossRef]
- Rayner, N.A.; Parker, D.E.; Horton, E.B.; Folland, C.K.; Alexander, L.V.; Rowell, D.P.; Kent, E.C.; Kaplan, A. Global analyses of sea surface temperature, sea ice, and night marine air temperature since the late nineteenth century. J. Geophys. Res. 2003, 108, 4407. [Google Scholar] [CrossRef]
- Carton, J.A.; Giese, B.S. A Reanalysis of Ocean Climate Using Simple Ocean Data Assimilation (SODA). Mon. Weather. Rev. 2008, 136, 2999–3017. [Google Scholar] [CrossRef]
- Poli, P.; Hersbach, H.; Dee, D.P.; Berrisford, P.; Simmons, A.J.; Vitart, F.; Laloyaux, P.; Tan, D.G.H.; Peubey, C.; Thépaut, J.-N.; et al. ERA-20C: An Atmospheric Reanalysis of the Twentieth Century. J. Clim. 2016, 29, 4083–4097. [Google Scholar] [CrossRef]
- Latif, M.; Barnett, T.P. Decadal Climate Variability over the North Pacific and North America: Dynamics and Predictability. J. Clim. 1996, 9, 2407–2423. [Google Scholar] [CrossRef]
- Arzel, O.; Huck, T. Contributions of Atmospheric Stochastic Forcing and Intrinsic Ocean Modes to North Atlantic Ocean Interdecadal Variability. J. Clim. 2020, 33, 2351–2370. [Google Scholar] [CrossRef]
- Newman, M.; Compo, G.P.; Alexander, M.A. ENSO-Forced Variability of the Pacific Decadal Oscillation. J Clim. 2003, 16, 3853–3857. [Google Scholar] [CrossRef]
- Alexander, M.A.; Deser, C. A Mechanism for the Recurrence of Wintertime Midlatitude SST Anomalies. J. Phys. Oceanogr. 1995, 25, 122–137. [Google Scholar] [CrossRef]
- Hanawa, K.; Sugimoto, S. ‘Reemergence’ areas of winter sea surface temperature anomalies in the world’s oceans. Geophys. Res. Lett. 2004, 31, L10303. [Google Scholar] [CrossRef]
- Wu, Y.; Latif, M.; Park, W. Multiyear predictability of Northern Hemisphere surface air temperature in the Kiel Climate Model. Clim. Dyn. 2015, 47, 793–804. [Google Scholar] [CrossRef]
- Good, S.A.; Martin, M.J.; Rayner, N.A. EN4: Quality controlled ocean temperature and salinity profiles and monthly objective analyses with uncertainty estimates: THE EN4 DATA SET. J. Geophys. Res. Ocean. 2013, 118, 6704–6716. [Google Scholar] [CrossRef]
- Murata, K.; Kido, S.; Tozuka, T. Role of Reemergence in the Central North Pacific Revealed by a Mixed Layer Heat Budget Analysis. Geophys. Res. Lett. 2020, 47, e2020GL088194. [Google Scholar] [CrossRef]
- Dias, D.F.; Subramanian, A.; Zanna, L.; Miller, A.J. Remote and local influences in forecasting Pacific SST: A linear inverse model and a multimodel ensemble study. Clim. Dyn. 2018, 52, 3183–3201. [Google Scholar] [CrossRef]
- Ding, R.; Li, J. Decadal and seasonal dependence of North Pacific sea surface temperature persistence. J. Geophys. Res. Atmos. 2009, 114, D01105. [Google Scholar] [CrossRef]
- Wang, H.; Kumar, A.; Wang, W.; Xue, Y. Influence of ENSO on Pacific Decadal Variability: An Analysis Based on the NCEP Climate Forecast System. J. Clim. 2012, 25, 6136–6151. [Google Scholar] [CrossRef]
Figure 1.
The predicted PDO using model-analogs during 1900–2015. (a) Spatial pattern at the 0-year lead of the predicted PDO (unit: °C); (b) spatial pattern of the observed PDO (unit: °C); (c) the time series of the lead time of 1−3 years (blue line); and (d) the time series of the lead time of 4–5 years (blue line). The observed PDO index is shown as the black line in (c,d). A 5-year running mean is applied to both predicted and observed PDO time series.

Figure 2.
Predictability changes with lead time: (a) ACC of predicted PDO time series using model-analogs against lead years during 1900−2015, (b) SRMSE of PDO time series against lead years. A 5-year running mean was applied to both predicted and observed PDO time series. Bars indicate a 95% confidence interval determined by the bootstrapping scheme.

Figure 3.
Multiyear predictability changes in PDO: (a) ACC and (b) SRMSE. X-axis shows the years of 50-year running windows. Y-axis shows different prediction leads (unit: year). In (a), a correlation coefficient exceeding 0.35 is 95% significantly different from 0. (c,d) ACC and SRMSE during 1910–1960 and 1960–2010, with bars indicating a 95% confidence interval determined by bootstrapping scheme.

Figure 4.
Illustration of the observed re-emergence of oceanic temperature anomalies. Regression of monthly ocean temperature anomalies (unit: °C) averaged in the northwestern Pacific (145–165° E, 40–45° N) upon the annual mean PDO time series during (a) 1910–1960 and (b) 1960–2010. Areas shown in dots are significant at the 95% level. Negative years mean that the PDO index leads to ocean temperature anomalies.

Figure 5.
ENSO influences on the North Pacific climate via an atmospheric bridge. Regression of the SLP (unit: hPa) upon Nino 3.4 index during two periods (shaded): (a) 1910–1960 and (b) 1960–2010. Areas shown in color are significant at a 95% confidence level.
Figure 5.
ENSO influences on the North Pacific climate via an atmospheric bridge. Regression of the SLP (unit: hPa) upon Nino 3.4 index during two periods (shaded): (a) 1910–1960 and (b) 1960–2010. Areas shown in color are significant at a 95% confidence level.

Disclaimer/Publisher’s Note: The statements, opinions and data contained in all publications are solely those of the individual author(s) and contributor(s) and not of MDPI and/or the editor(s). MDPI and/or the editor(s) disclaim responsibility for any injury to people or property resulting from any ideas, methods, instructions or products referred to in the content. |
© 2023 by the authors. Licensee MDPI, Basel, Switzerland. This article is an open access article distributed under the terms and conditions of the Creative Commons Attribution (CC BY) license (https://creativecommons.org/licenses/by/4.0/).
Share and Cite
MDPI and ACS Style
Wu, Y.; Yan, X. Evaluating Changes in the Multiyear Predictability of the Pacific Decadal Oscillation Using Model Analogs since 1900. J. Mar. Sci. Eng. 2023, 11, 980. https://doi.org/10.3390/jmse11050980
AMA Style
Wu Y, Yan X. Evaluating Changes in the Multiyear Predictability of the Pacific Decadal Oscillation Using Model Analogs since 1900. Journal of Marine Science and Engineering. 2023; 11(5):980. https://doi.org/10.3390/jmse11050980
Chicago/Turabian StyleWu, Yanling, and Xiaoqin Yan. 2023. "Evaluating Changes in the Multiyear Predictability of the Pacific Decadal Oscillation Using Model Analogs since 1900" Journal of Marine Science and Engineering 11, no. 5: 980. https://doi.org/10.3390/jmse11050980
Note that from the first issue of 2016, this journal uses article numbers instead of page numbers. See further details here.